Waiters and Waitresses: Career Overview
Take orders and serve food and beverages to patrons at tables in dining establishment.
Featured schools near , edit
What Tasks Do Waiters and Waitresses Do?
The core tasks performed by waiters and waitresses span:
- Collect payments from customers.
- Check patrons' identification to ensure that they meet minimum age requirements for consumption of alcoholic beverages.
- Write patrons' food orders on order slips, memorize orders, or enter orders into computers for transmittal to kitchen staff.
- Check with customers to ensure that they are enjoying their meals, and take action to correct any problems.
- Take orders from patrons for food or beverages.
- Prepare checks that itemize and total meal costs and sales taxes.
- Remove dishes and glasses from tables or counters, and take them to kitchen for cleaning.
- Clean tables or counters after patrons have finished dining.
Skills and Knowledge
Effective waiters and waitresses combine a mix of skills and domain knowledge.
Most Important Skills
The competencies that matter most in this role, rated on an importance scale of 0 to 5:
Top Knowledge Areas
Related Job Titles
Common job titles for this role include:
- Banquet Server
- Banquet Waiter
- Banquet Waitress
- Bar Waiter
- Bar Waitress
- Buffet Waiter
- Buffet Waitress
- Busser
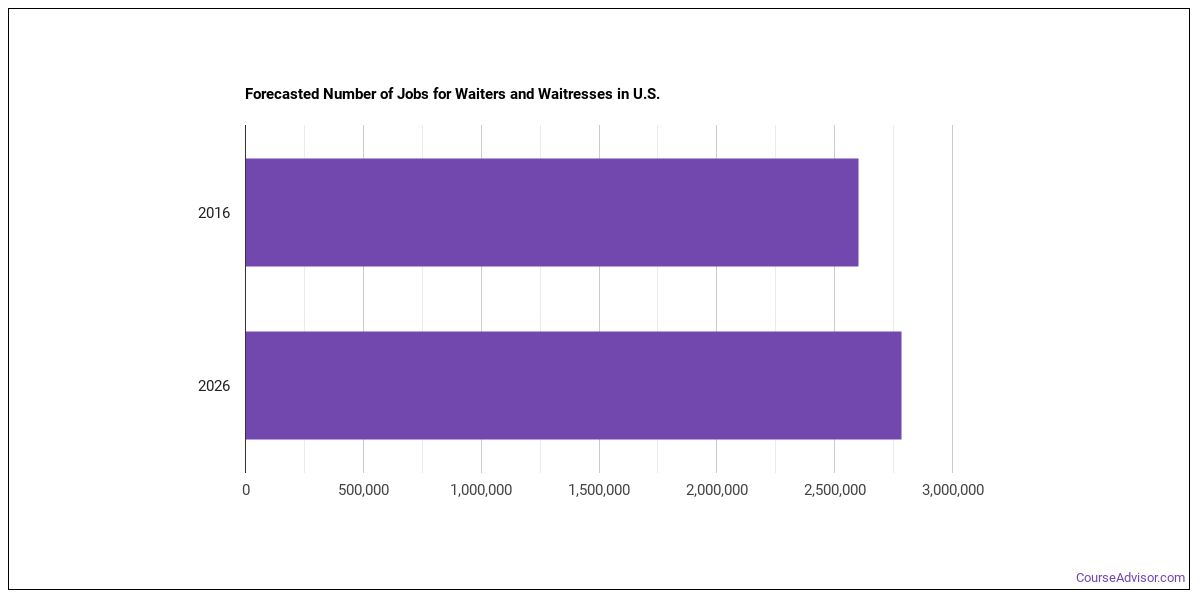
Employment and Demand
The U.S. employs around 1,737,342 waiters and waitresses working in the United States today. This occupation is expected to grow by +6.1% over the projection horizon.
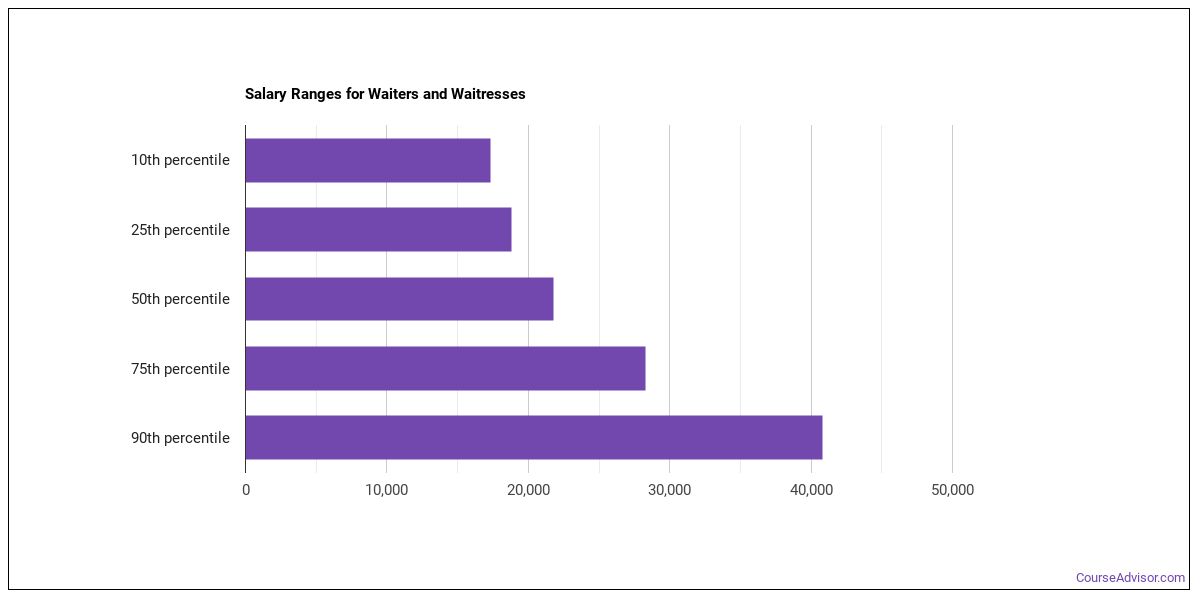
Salary for Waiters and Waitresses
| Statistic | Value |
|---|---|
| Annual median | $42,006 |
| Hourly median | $20.20 |
| 10th percentile | $26,382 |
| 25th percentile | $34,194 |
| 75th percentile | $49,818 |
| 90th percentile | $57,630 |
Compensation varies based on experience, location, and industry.
How Much Do Waiters and Waitresses Make in Different U.S. States?
| State | Annual median salary |
|---|---|
| Vermont | $60,910 |
| Hawaii | $48,570 |
| Washington | $47,490 |
| New York | $46,460 |
| District of Columbia | $45,770 |
| Maine | $44,550 |
| Rhode Island | $42,600 |
| New Hampshire | $39,270 |
| New Jersey | $38,720 |
| Virginia | $36,990 |
| Arizona | $36,730 |
| Connecticut | $36,440 |
| Massachusetts | $36,390 |
| Ohio | $36,030 |
| Michigan | $35,940 |
| California | $35,290 |
| Maryland | $35,140 |
| Colorado | $34,990 |
| Nebraska | $34,000 |
| Oregon | $33,930 |
| Delaware | $33,750 |
| Virgin Islands | $32,230 |
| Kansas | $31,560 |
| Idaho | $30,540 |
| New Mexico | $30,440 |
| West Virginia | $30,320 |
| Pennsylvania | $30,300 |
| Utah | $29,860 |
| Florida | $29,580 |
| North Dakota | $29,420 |
| Illinois | $29,120 |
| South Dakota | $29,080 |
| Wisconsin | $29,050 |
| North Carolina | $28,460 |
| Tennessee | $28,410 |
| Texas | $27,930 |
| Indiana | $27,420 |
| Alaska | $27,370 |
| Missouri | $26,950 |
| Arkansas | $26,350 |
| Iowa | $26,140 |
| Wyoming | $25,340 |
| Nevada | $24,960 |
| Minnesota | $24,470 |
| Montana | $22,630 |
| Kentucky | $22,260 |
| Alabama | $21,920 |
| Puerto Rico | $21,290 |
| Guam | $20,480 |
| Mississippi | $20,340 |
| Georgia | $20,040 |
| Oklahoma | $19,890 |
| South Carolina | $18,530 |
| Louisiana | $16,880 |
Top-Paying U.S. Regions
Compensation for waiters and waitresses vary by region. The following regions pay the most:
| Region | Median annual wage | Share of U.S. jobs | Location quotient |
|---|---|---|---|
| Middle Atlantic | $39,586 | 14.5% | 0.95 |
| New England | $38,860 | 4.6% | 0.98 |
| Far Western US | $35,948 | 15.8% | 1.00 |
| Great Lakes | $32,006 | 13.3% | 0.94 |
| Rocky Mountains | $31,705 | 3.6% | 0.91 |
| Southwest | $28,929 | 13.1% | 1.05 |
| Plains States | $27,620 | 6.4% | 0.93 |
| Southeast | $26,632 | 27.8% | 1.16 |
Highest-Paying Metro Areas for Waiters and Waitresses
| Metro area | State | Median annual wage | Employment |
|---|---|---|---|
| Kahului-Wailuku, HI | HI | $71,920 | 2,460 |
| Burlington-South Burlington, VT | VT | $66,350 | 1,510 |
| Seattle-Tacoma-Bellevue, WA | WA | $48,760 | 25,860 |
| Albany-Schenectady-Troy, NY | NY | $48,110 | 6,100 |
| Syracuse, NY | NY | $47,830 | 3,640 |
| Binghamton, NY | NY | $47,650 | 1,430 |
| Mount Vernon-Anacortes, WA | WA | $47,560 | 780 |
| Utica-Rome, NY | NY | $47,380 | 1,700 |
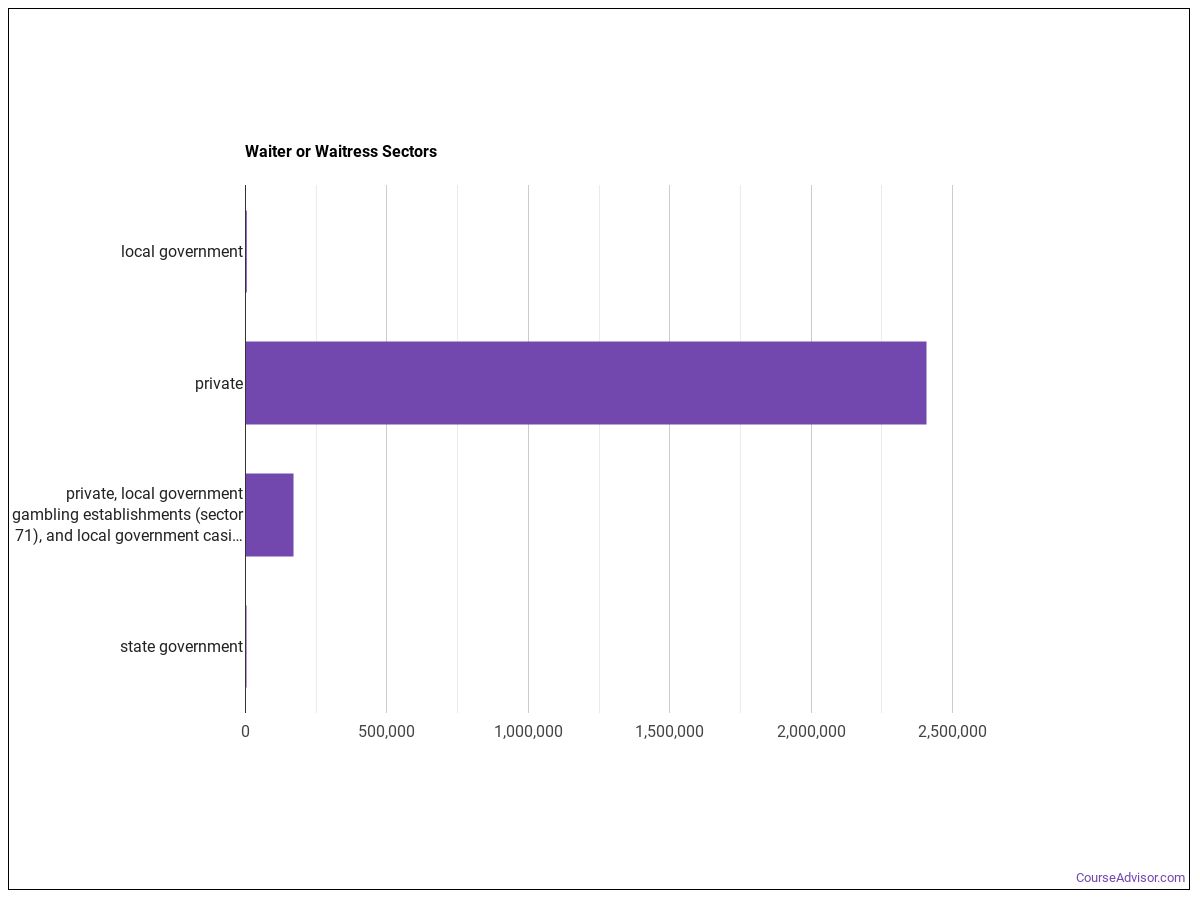
Which Industries Hire Waiters and Waitresses
Most waiters and waitresses are concentrated in the following sectors:
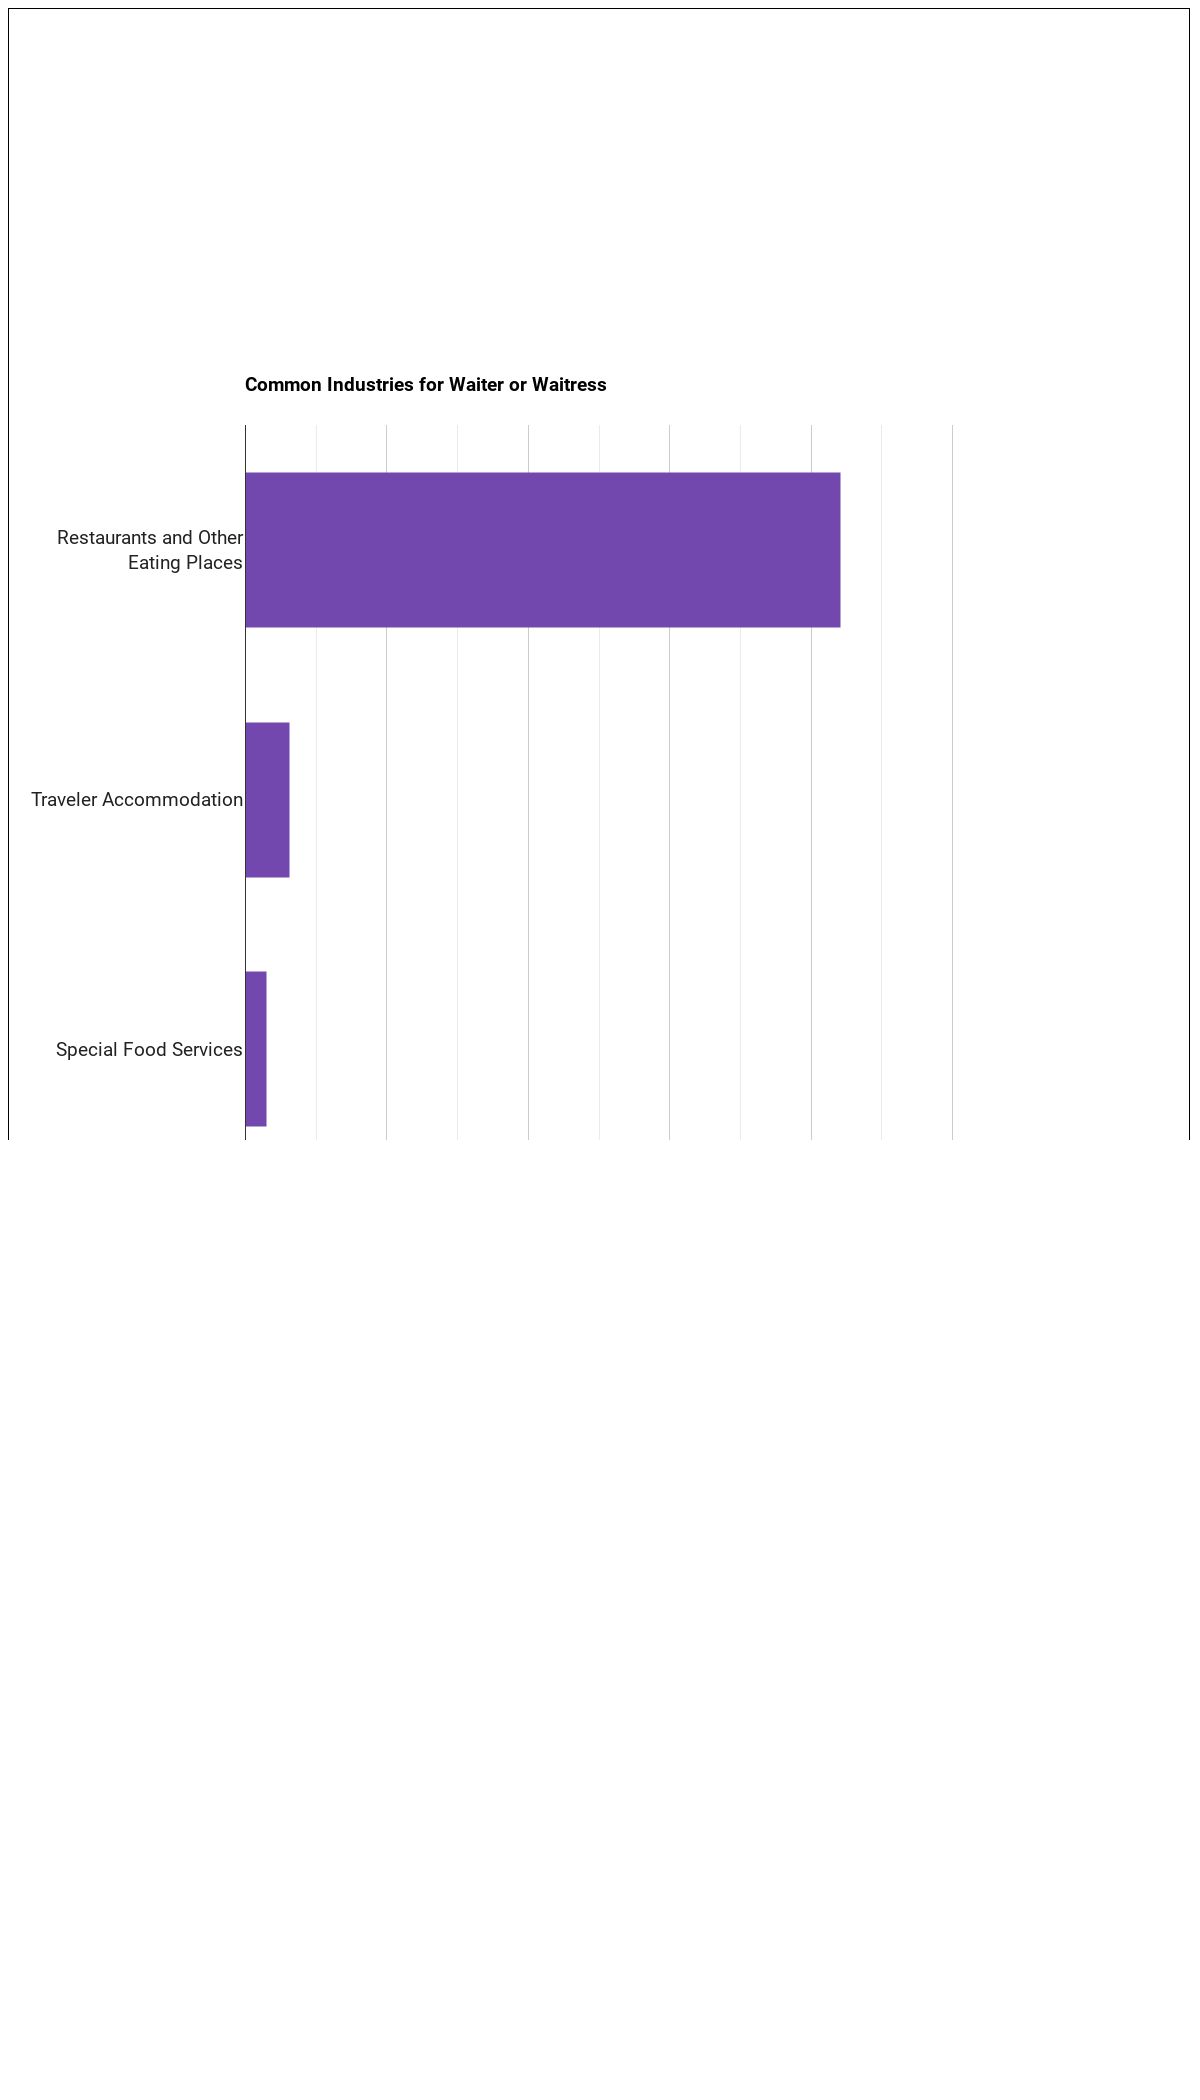
| Industry | Employment | Median annual wage |
|---|---|---|
| Accommodation and Food Services | 2,116,650 | $33,710 |
| Arts, Entertainment, and Recreation | 96,680 | $34,350 |
| Manufacturing | 20,180 | $36,120 |
| Health Care and Social Assistance | 15,640 | $32,610 |
| Administrative and Support and Waste Management and Remediation Services | 15,470 | $37,440 |
| Other Services (except Public Administration) | 11,970 | $33,990 |
| Retail Trade | 7,700 | $29,120 |
| Information | 4,930 | $29,850 |
Below are examples of industries where waiters and waitresses work:
Software Waiters and Waitresses Use
- Web page creation and editing software: Facebook (hot technology)
What the Workplace Is Like
Daily working conditions for waiters and waitresses tends to involve the following characteristics:
- Contact With Others
- Spend Time Standing
- Face-to-Face Discussions with Individuals and Within Teams
- Spend Time Walking or Running
- Work With or Contribute to a Work Group or Team
Education and Training
Most waiters and waitresses positions require a high school diploma or equivalent as the typical entry-level education. This occupation sits in Some Preparation Needed (Job Zone 2), reflecting the level of preparation typically expected.
Related Careers
Similar Occupations
- Food Service Managers (Primary-Long)
- Chefs and Head Cooks (Supplemental)
- First-Line Supervisors of Food Preparation and Serving Workers (Primary-Long)
- Cooks, Fast Food (Supplemental)
- Cooks, Institution and Cafeteria (Supplemental)
- Cooks, Private Household (Supplemental)
- Cooks, Restaurant (Supplemental)
- Cooks, Short Order (Primary-Long)
Sources
This profile draws on the following authoritative sources:
- U.S. Bureau of Labor Statistics — Occupational Employment and Wage Statistics (OEWS) for employment and wage data by state and industry.
- BLS Employment Projections for total employment and growth forecasts.
- O*NET (Occupational Information Network) for skills, knowledge, tasks, work activities, work context, technology, and education-zone data.
SOC code: 35-3031.00 (Waiters and Waitresses).
Course Advisor provides higher-education, college and university, degree, program, career, salary, and other helpful information to students, faculty, institutions, and other internet audiences. Presented information and data are subject to change. Inclusion on this website does not imply or represent a direct relationship with the company, school, or brand. Information, though believed correct at time of publication, may not be correct, and no warranty is provided. Contact the schools to verify any information before relying on it. Financial aid may be available for those who qualify. The displayed options may include sponsored or recommended results, not necessarily based on your preferences.
© Course Advisor – All Rights Reserved.