Occupational Therapists in Massachusetts
Thinking about a career as an Occupational Therapists in Massachusetts? Here’s what you need to know. Assess, plan, and organize rehabilitative programs that help build or restore vocational, homemaking, and daily living skills, as well as general independence, to persons with disabilities or developmental delays. Use therapeutic techniques, adapt the individual’s environment, teach skills, and modify specific tasks that present barriers to the individual. Excludes “Rehabilitation Counselors” (21-1015).
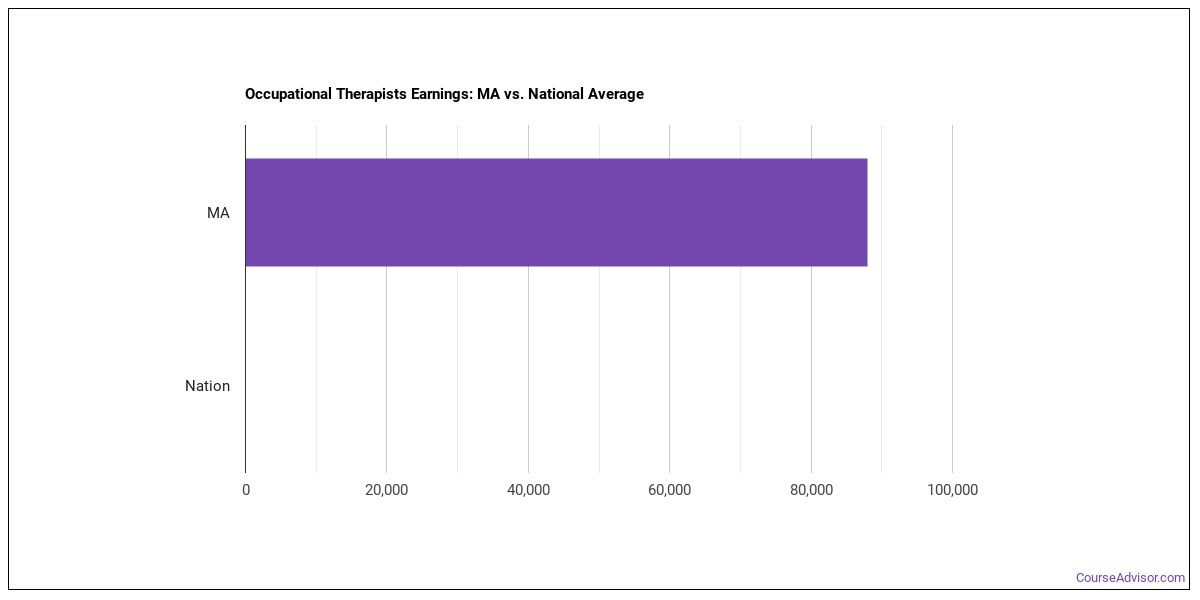
What do Occupational Therapists Make in Massachusetts?
The occupational therapists working in Massachusetts, wages run about $98,420 per year (or about $47.32/hour).Earnings range from $73,020 at the 10th percentile to $122,490 at the 90th percentile.
| Wage Statistic | Annual | Hourly |
|---|---|---|
| 10th percentile | $73,020 | $35.11 |
| 25th percentile | $83,400 | $40.10 |
| Median (50th) | $98,420 | $47.32 |
| 75th percentile | $106,040 | $50.98 |
| 90th percentile | $122,490 | $58.89 |

The job concentration index in Massachusetts nationwide is 1.74, meaning that occupational therapists are more concentrated here than the national average.
National Wage Comparison
Nationally, occupational therapists earn a median of $82,501 per year ($39.66/hour), exceeding the Massachusetts median.
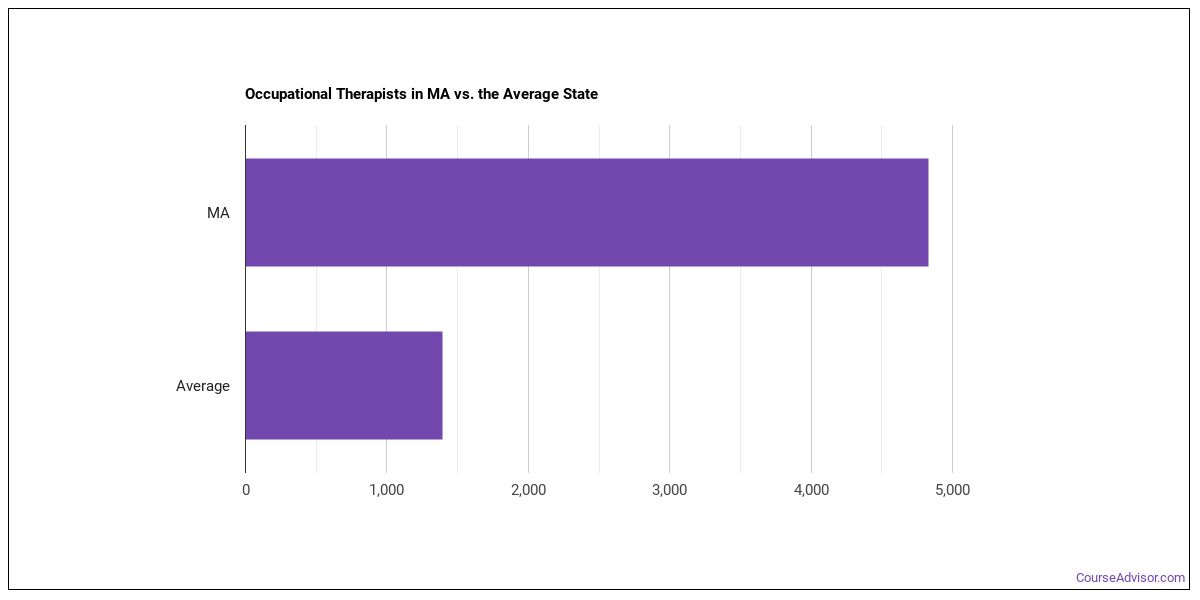
Employment Outlook
Nationally, total employment in this occupation is 2,446,955 occupational therapists nationwide. In Massachusetts alone, approximately 6,250 people work in this role. That’s higher than the typical state, which employs around 1,940 occupational therapists.

Top Massachusetts Metros for Occupational Therapists
These are the Massachusetts metros with the most occupational therapists in Massachusetts.
| Metro Area | Number Employed | Annual Median Salary |
|---|---|---|
| Boston-Cambridge-Newton, MA-NH | 4,650 | $98,790 |
| Worcester, MA | 760 | $96,800 |
| Springfield, MA | 380 | $92,890 |
| Barnstable Town, MA | 180 | $98,720 |
| Pittsfield, MA | 100 | $86,250 |
| Amherst Town-Northampton, MA | 80 | $96,910 |
Top States for Occupational Therapists Employment
These states have the highest employment of occupational therapists work.
| State | Number Employed |
|---|---|
| California | 12,020 |
| Texas | 11,700 |
| New York | 10,540 |
| Florida | 9,230 |
| Illinois | 7,410 |
| Pennsylvania | 7,200 |
| Ohio | 6,480 |
| Massachusetts | 6,250 |
| Michigan | 5,090 |
| North Carolina | 4,910 |
| New Jersey | 4,830 |
| Colorado | 3,740 |
| Georgia | 3,670 |
| Virginia | 3,670 |
| Wisconsin | 3,620 |
| Indiana | 3,440 |
| Washington | 3,410 |
| Minnesota | 3,360 |
| Connecticut | 3,000 |
| Missouri | 2,850 |
Highest-Paying States for Occupational Therapists
Where occupational therapists earn the most: occupational therapists.
| State | Annual Median Salary |
|---|---|
| California | $119,470 |
| Oregon | $106,840 |
| Nevada | $104,770 |
| Colorado | $103,970 |
| Oklahoma | $103,510 |
| New Jersey | $103,340 |
| Washington | $102,360 |
| Arizona | $102,220 |
| Connecticut | $102,080 |
| Maryland | $101,880 |
Skills
The most important occupational therapists skills, rated on an importance scale of 0 to 5:
Knowledge Areas
Key knowledge areas for this occupation, rated on an importance scale of 0 to 5:
Abilities
Key abilities for occupational therapists, rated on an importance scale of 0 to 5:
Daily Tasks
Day-to-day, occupational therapists typically:
- Test and evaluate patients' physical and mental abilities and analyze medical data to determine realistic rehabilitation goals for patients.
- Complete and maintain necessary records.
- Plan, organize, and conduct occupational therapy programs in hospital, institutional, or community settings to help rehabilitate persons with disabilities because of illness, injury or psychological or developmental problems.
- Plan and implement programs and social activities to help patients learn work or school skills and adjust to handicaps.
- Select activities that will help individuals learn work and life-management skills within limits of their mental or physical capabilities.
- Evaluate patients' progress and prepare reports that detail progress.
- Train caregivers in providing for the needs of a patient during and after therapy.
- Lay out materials such as puzzles, scissors and eating utensils for use in therapy, and clean and repair these tools after therapy sessions.
- Consult with rehabilitation team to select activity programs or coordinate occupational therapy with other therapeutic activities.
- Design and create, or requisition, special supplies and equipment, such as splints, braces, and computer-aided adaptive equipment.
- Recommend changes in patients' work or living environments, consistent with their needs and capabilities.
- Develop and participate in health promotion programs, group activities, or discussions to promote client health, facilitate social adjustment, alleviate stress, and prevent physical or mental disability.
Work Activities
- Documenting/Recording Information
- Assisting and Caring for Others
- Getting Information
- Making Decisions and Solving Problems
- Developing Objectives and Strategies
- Communicating with Supervisors, Peers, or Subordinates
- Establishing and Maintaining Interpersonal Relationships
- Updating and Using Relevant Knowledge
- Identifying Objects, Actions, and Events
- Organizing, Planning, and Prioritizing Work
- Thinking Creatively
- Interpreting the Meaning of Information for Others
Tools & Technology
Common tools and software used in this occupation include: Hot technologies: eClinicalWorks EHR software
What Major Will Prepare You For This Career?
Related college programs include:
- Rehabilitation Professions
Featured schools near , edit
Related Careers
Careers similar to occupational therapists include:
- Mental Health Counselors
- Rehabilitation Counselors
- Mental Health and Substance Abuse Social Workers
- Low Vision Therapists, Orientation and Mobility Specialists, and Vision Rehabilitation Therapists
- Physical Therapists
- Recreational Therapists
Also Known As
Acute Care OT (Acute Care Occupational Therapist), Assistive Technology Trainer, Certified Hand Therapist (CHT), Early Intervention Occupational Therapist, Home Care Occupational Therapist (Home Care OT), Home Health Occupational Therapist, Independent Living Specialist, Industrial Rehabilitation Consultant, Industrial Therapist, Inpatient Occupational Therapist (Inpatient OT), Job Trainer, Occupational Therapist (OT), Outpatient Occupational Therapist (Outpatient OT), Pediatric Occupational Therapist (Pediatric OT), Pediatrics and Acute Care Occupational Therapist.
References
- U.S. Bureau of Labor Statistics, Occupational Employment and Wage Statistics — https://www.bls.gov/oes/
- O*NET Online — https://www.onetonline.org/
- BLS Employment Projections — https://www.bls.gov/emp/
- O*NET-SOC code: 29-1122.00
Course Advisor provides higher-education, college and university, degree, program, career, salary, and other helpful information to students, faculty, institutions, and other internet audiences. Presented information and data are subject to change. Inclusion on this website does not imply or represent a direct relationship with the company, school, or brand. Information, though believed correct at time of publication, may not be correct, and no warranty is provided. Contact the schools to verify any information before relying on it. Financial aid may be available for those who qualify. The displayed options may include sponsored or recommended results, not necessarily based on your preferences.
© Course Advisor – All Rights Reserved.