Health and Safety Engineers, Except Mining Safety Engineers and Inspectors in California
Thinking about a career as a Health and Safety Engineers, Except Mining Safety Engineers and Inspectors in California? Here’s what you need to know. Promote worksite or product safety by applying knowledge of industrial processes, mechanics, chemistry, psychology, and industrial health and safety laws. Includes industrial product safety engineers.
What do Health and Safety Engineers, Except Mining Safety Engineers and Inspectors Make in California?
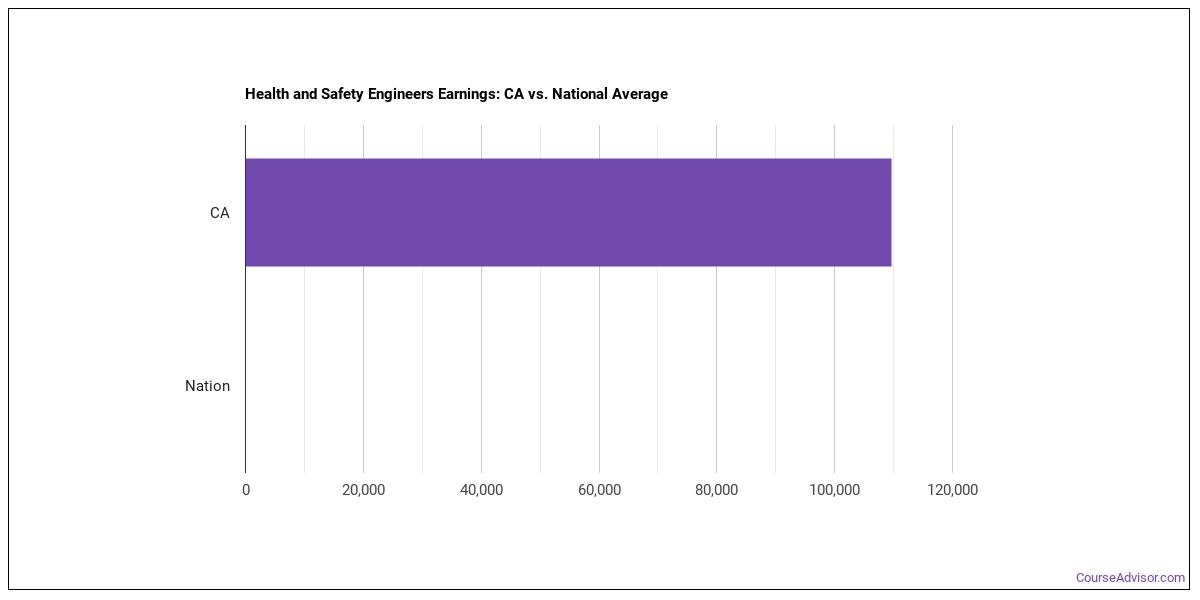
The health and safety engineers, except mining safety engineers and inspectors working in California, the typical annual salary is $125,410 per year (or about $60.29/hour).Earnings range from $48,600 at the 10th percentile to $174,720 at the 90th percentile.
| Wage Statistic | Annual | Hourly |
|---|---|---|
| 10th percentile | $48,600 | $23.37 |
| 25th percentile | $97,190 | $46.73 |
| Median (50th) | $125,410 | $60.29 |
| 75th percentile | $148,810 | $71.55 |
| 90th percentile | $174,720 | $84.00 |

The job concentration index in California relative to the national average — is 1.11, indicating that health and safety engineers, except mining safety engineers and inspectors are more concentrated here than the national average.
National Wage Comparison
Nationally, health and safety engineers, except mining safety engineers and inspectors earn a median of $122,201 per year ($58.75/hour), exceeding the California median.
Employment Outlook
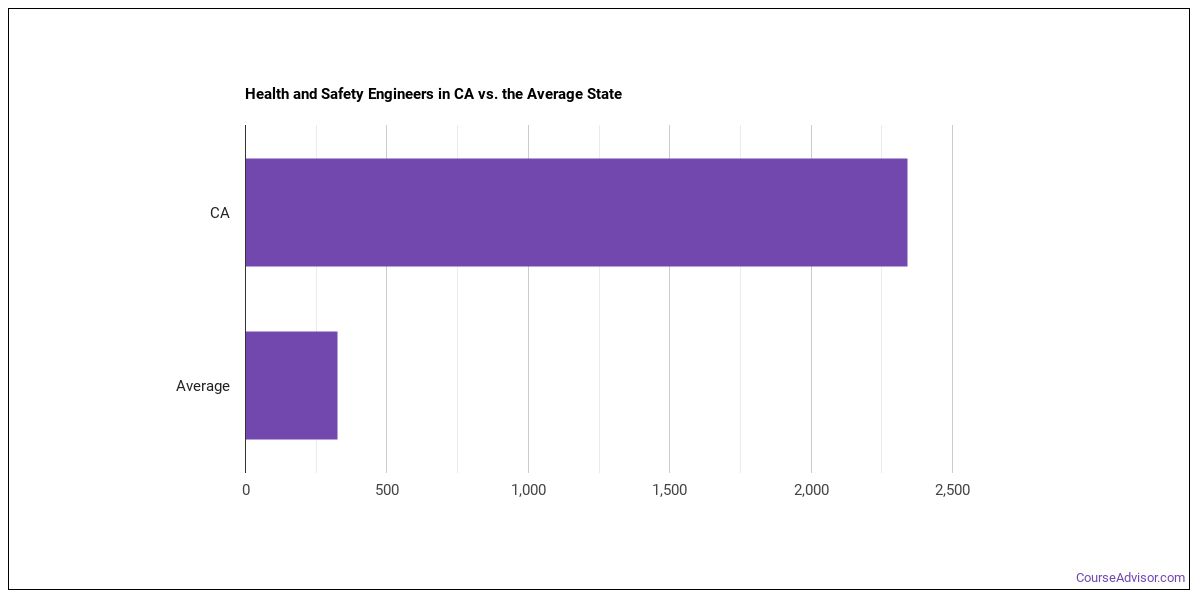
Nationally, total employment in this occupation is 101,499 health and safety engineers, except mining safety engineers and inspectors across the United States. In California alone, about 3,010 people work in this role. That’s more than the typical state, which employs around 280 health and safety engineers, except mining safety engineers and inspectors.

Top California Metros for Health and Safety Engineers, Except Mining Safety Engineers and Inspectors
These are the California metros with the most health and safety engineers, except mining safety engineers and inspectors in California.
| Metro Area | Number Employed | Annual Median Salary |
|---|---|---|
| Los Angeles-Long Beach-Anaheim, CA | 900 | $124,970 |
| San Francisco-Oakland-Fremont, CA | 570 | $128,670 |
| San Diego-Chula Vista-Carlsbad, CA | 260 | $110,100 |
| Riverside-San Bernardino-Ontario, CA | 250 | $129,580 |
| Sacramento-Roseville-Folsom, CA | 210 | $138,780 |
| San Jose-Sunnyvale-Santa Clara, CA | 180 | $132,140 |
| Bakersfield-Delano, CA | 60 | $122,310 |
| Oxnard-Thousand Oaks-Ventura, CA | 60 | $113,830 |
| Fresno, CA | 50 | $110,930 |
| Vallejo, CA | 40 | $117,490 |
| Santa Maria-Santa Barbara, CA | 30 | $147,060 |
| Stockton-Lodi, CA | 30 | $83,780 |
Top States for Health and Safety Engineers, Except Mining Safety Engineers and Inspectors Employment
View the states that employ the most health and safety engineers, except mining safety engineers and inspectors work.
| State | Number Employed |
|---|---|
| Texas | 3,180 |
| California | 3,010 |
| New York | 1,600 |
| Pennsylvania | 1,390 |
| Michigan | 1,300 |
| Florida | 1,080 |
| Oklahoma | 800 |
| Washington | 590 |
| Massachusetts | 580 |
| North Carolina | 570 |
| New Jersey | 560 |
| Alabama | 550 |
| Maryland | 500 |
| Wisconsin | 480 |
| Georgia | 450 |
| New Mexico | 430 |
| Louisiana | 400 |
| Ohio | 380 |
| Virginia | 360 |
| Kentucky | 330 |
Highest-Paying States for Health and Safety Engineers, Except Mining Safety Engineers and Inspectors
Where health and safety engineers, except mining safety engineers and inspectors earn the most: health and safety engineers, except mining safety engineers and inspectors.
| State | Annual Median Salary |
|---|---|
| District of Columbia | $135,810 |
| Massachusetts | $131,500 |
| Oregon | $128,760 |
| California | $125,410 |
| Texas | $123,020 |
| Washington | $121,730 |
| Iowa | $121,520 |
| New York | $119,030 |
| Delaware | $117,250 |
| Ohio | $117,080 |
Skills
Key health and safety engineers, except mining safety engineers and inspectors skills, rated on an importance scale of 0 to 5:
Knowledge Areas
Key knowledge areas for this occupation, rated on an importance scale of 0 to 5:
Abilities
The abilities that matter most for health and safety engineers, except mining safety engineers and inspectors, rated on an importance scale of 0 to 5:
Daily Tasks
Health and Safety Engineers, Except Mining Safety Engineers and Inspectors typically:
- Investigate industrial accidents, injuries, or occupational diseases to determine causes and preventive measures.
- Conduct research to evaluate safety levels for products.
- Evaluate product designs for safety.
- Conduct or coordinate worker training in areas such as safety laws and regulations, hazardous condition monitoring, and use of safety equipment.
- Maintain and apply knowledge of current policies, regulations, and industrial processes.
- Recommend procedures for detection, prevention, and elimination of physical, chemical, or other product hazards.
- Report or review findings from accident investigations, facilities inspections, or environmental testing.
- Evaluate potential health hazards or damage that could occur from product misuse.
- Evaluate adequacy of actions taken to correct health inspection violations.
- Interpret safety regulations for others interested in industrial safety, such as safety engineers, labor representatives, and safety inspectors.
- Review plans and specifications for construction of new machinery or equipment to determine whether all safety requirements have been met.
- Participate in preparation of product usage and precautionary label instructions.
Work Activities
- Evaluating Information to Determine Compliance with Standards
- Getting Information
- Making Decisions and Solving Problems
- Communicating with Supervisors, Peers, or Subordinates
- Inspecting Equipment, Structures, or Materials
- Identifying Objects, Actions, and Events
- Documenting/Recording Information
- Organizing, Planning, and Prioritizing Work
- Interpreting the Meaning of Information for Others
- Updating and Using Relevant Knowledge
- Training and Teaching Others
- Analyzing Data or Information
Tools & Technology
Software and systems commonly involved: Hot technologies: Autodesk AutoCAD, C++, Eclipse IDE In-demand technologies: Autodesk AutoCAD
What Major Will Prepare You For This Career?
Several college majors map to this occupation:
- Other Engineering
- Environmental Engineering
Featured schools near , edit
Related Careers
Related occupations to health and safety engineers, except mining safety engineers and inspectors include:
- Quality Control Systems Managers
- Compliance Managers
- Environmental Compliance Inspectors
- Security Management Specialists
- Penetration Testers
- Environmental Engineers
Also Known As
Chemical Detection Expert, EHS Intern (Environmental Health and Safety Intern), Engineer, Environmental Health and Safety Coordinator (EHS Coordinator), Environmental Health and Safety Engineer (EHS Engineer), Environmental Health and Safety Manager, Environmental Health and Safety Specialist (EHS Specialist), Extra Vehicular Activity Safety Engineer (EVA Engineer), Fire Prevention Engineer, Fire Protection Engineer, Functional Safety Engineer, HSE Engineer (Health, Safety and Environmental Engineer), Health Safety and Environmental Specialist (HSE Specialist), Health and Safety Coordinator, Health and Safety Engineer.
References
- U.S. Bureau of Labor Statistics, Occupational Employment and Wage Statistics — https://www.bls.gov/oes/
- O*NET Online — https://www.onetonline.org/
- BLS Employment Projections — https://www.bls.gov/emp/
- O*NET-SOC code: 17-2111.00
Course Advisor provides higher-education, college and university, degree, program, career, salary, and other helpful information to students, faculty, institutions, and other internet audiences. Presented information and data are subject to change. Inclusion on this website does not imply or represent a direct relationship with the company, school, or brand. Information, though believed correct at time of publication, may not be correct, and no warranty is provided. Contact the schools to verify any information before relying on it. Financial aid may be available for those who qualify. The displayed options may include sponsored or recommended results, not necessarily based on your preferences.
© Course Advisor – All Rights Reserved.