File Clerks in California
Thinking about a career as a File Clerks in California? Here’s what the data says. File correspondence, cards, invoices, receipts, and other records in alphabetical or numerical order or according to the filing system used. Locate and remove material from file when requested.
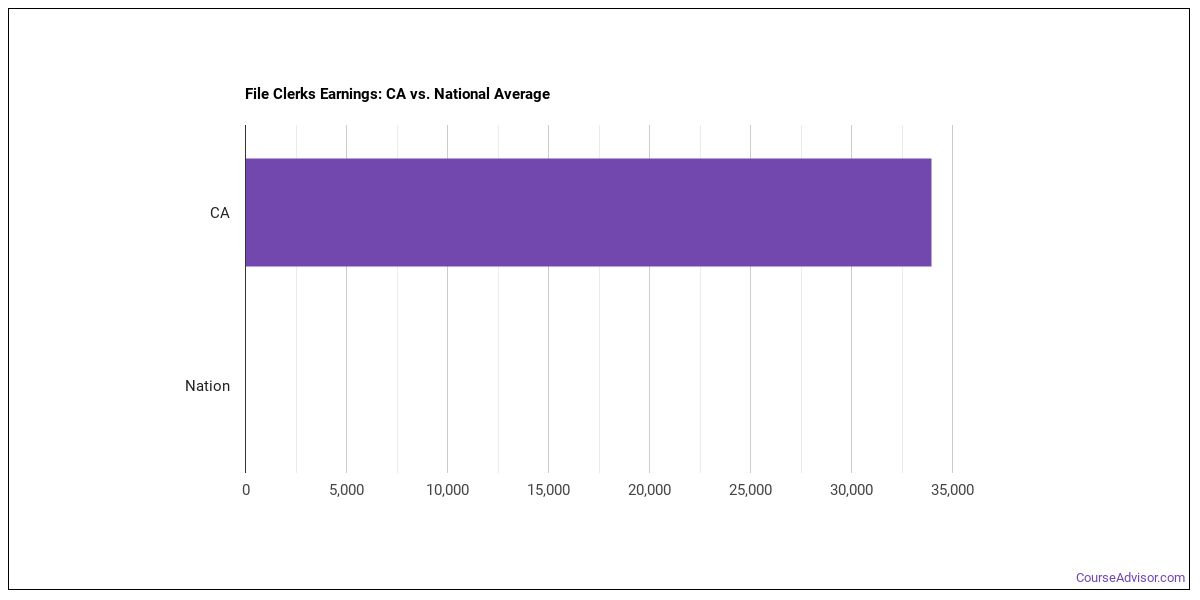
What do File Clerks Make in California?
For file clerks working in California, the typical annual salary is $46,920 per year (or about $22.56/hour).Earnings range from $35,640 at the 10th percentile to $70,060 at the 90th percentile.
| Wage Statistic | Annual | Hourly |
|---|---|---|
| 10th percentile | $35,640 | $17.14 |
| 25th percentile | $37,870 | $18.21 |
| Median (50th) | $46,920 | $22.56 |
| 75th percentile | $58,780 | $28.26 |
| 90th percentile | $70,060 | $33.68 |

The job concentration index in California nationwide is 1.05.
National Wage Comparison
Nationally, file clerks earn a median of $28,086 per year ($13.50/hour), exceeding the California median.
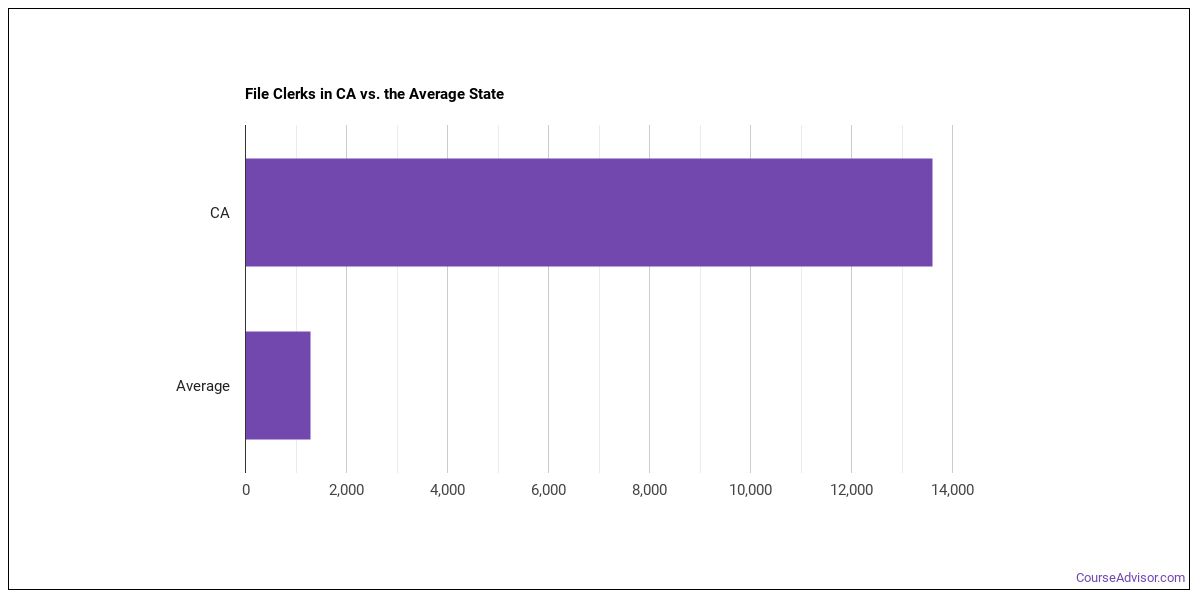
Employment Outlook
National employment for 787,455 file clerks across the United States. In California alone, around 9,740 people work in this role. That’s higher than the typical state, which employs around 790 file clerks.

Top California Metros for File Clerks
These are the California metros with the most file clerks in California.
| Metro Area | Number Employed | Annual Median Salary |
|---|---|---|
| Los Angeles-Long Beach-Anaheim, CA | 3,380 | $45,940 |
| San Francisco-Oakland-Fremont, CA | 1,230 | $47,990 |
| San Diego-Chula Vista-Carlsbad, CA | 1,070 | $47,330 |
| Riverside-San Bernardino-Ontario, CA | 890 | $46,400 |
| San Jose-Sunnyvale-Santa Clara, CA | 600 | $59,480 |
| Sacramento-Roseville-Folsom, CA | 520 | $46,940 |
| Oxnard-Thousand Oaks-Ventura, CA | 260 | $41,600 |
| Fresno, CA | 220 | $39,830 |
| Bakersfield-Delano, CA | 190 | $41,380 |
| Modesto, CA | 140 | $51,330 |
| Stockton-Lodi, CA | 130 | $48,080 |
| Santa Rosa-Petaluma, CA | 120 | $49,420 |
| Visalia, CA | 100 | $40,300 |
| Santa Maria-Santa Barbara, CA | 80 | $44,330 |
| Vallejo, CA | 80 | $44,320 |
| Salinas, CA | 70 | $48,980 |
| Napa, CA | 60 | $48,500 |
| Santa Cruz-Watsonville, CA | 60 | $58,780 |
| Redding, CA | 50 | $41,440 |
| San Luis Obispo-Paso Robles, CA | 50 | $58,300 |
| Merced, CA | 30 | $45,770 |
Top States for File Clerks Employment
These states have the highest employment of file clerks work.
| State | Number Employed |
|---|---|
| Texas | 12,820 |
| California | 9,740 |
| Florida | 6,350 |
| New York | 4,450 |
| Illinois | 3,740 |
| Tennessee | 2,750 |
| New Jersey | 2,690 |
| Pennsylvania | 2,570 |
| North Carolina | 2,210 |
| Arizona | 2,110 |
| Georgia | 2,100 |
| Michigan | 2,090 |
| Indiana | 1,970 |
| Ohio | 1,920 |
| Wisconsin | 1,660 |
| Colorado | 1,550 |
| Oklahoma | 1,460 |
| Virginia | 1,420 |
| South Carolina | 1,020 |
| Missouri | 970 |
Highest-Paying States for File Clerks
The highest-paying states for file clerks.
| State | Annual Median Salary |
|---|---|
| District of Columbia | $57,560 |
| Oregon | $49,340 |
| Rhode Island | $48,440 |
| Washington | $47,100 |
| California | $46,920 |
| Massachusetts | $46,570 |
| Illinois | $46,320 |
| Hawaii | $46,250 |
| Minnesota | $45,310 |
| Iowa | $44,930 |
Skills
Key file clerks skills, rated on an importance scale of 0 to 5:
Knowledge Areas
Important knowledge areas for this occupation, rated on an importance scale of 0 to 5:
Abilities
Key abilities for file clerks, rated on an importance scale of 0 to 5:
Daily Tasks
Common tasks include:
- Perform general office activities, such as typing, answering telephones, operating office machines, processing mail, or securing confidential materials.
- Keep records of materials filed or removed, using logbooks or computers and generate computerized reports.
- Gather materials to be filed from departments or employees.
- Find, retrieve, and make copies of information from files in response to requests and deliver information to authorized users.
- Add new material to file records or create new records as necessary.
- Sort or classify information according to guidelines, such as content, purpose, user criteria, or chronological, alphabetical, or numerical order.
- Scan or read incoming materials to determine how and where they should be classified or filed.
- Eliminate outdated or unnecessary materials, destroying them or transferring them to inactive storage, according to file maintenance guidelines or legal requirements.
- Answer questions about records or files.
- Assign and record or stamp identification numbers or codes to index materials for filing.
- Place materials into storage receptacles, such as file cabinets, boxes, bins, or drawers, according to classification and identification information.
- Modify or improve filing systems or implement new filing systems.
Work Activities
- Working with Computers
- Organizing, Planning, and Prioritizing Work
- Processing Information
- Updating and Using Relevant Knowledge
- Establishing and Maintaining Interpersonal Relationships
- Analyzing Data or Information
- Making Decisions and Solving Problems
- Documenting/Recording Information
- Getting Information
- Communicating with Supervisors, Peers, or Subordinates
- Performing Administrative Activities
- Evaluating Information to Determine Compliance with Standards
Tools & Technology
Common tools and software used in this occupation include: Hot technologies: Adobe Acrobat, Intuit QuickBooks In-demand technologies: Microsoft Excel
What Major Will Prepare You For This Career?
Several college majors map to this occupation:
- Business Support & Assistance
Featured schools near , edit
Related Careers
Other careers like file clerks include:
- Management Analysts
- Document Management Specialists
- Title Examiners, Abstractors, and Searchers
- Archivists
- Court Reporters and Simultaneous Captioners
- Medical Records Specialists
Also Known As
Admissions Clerk, Blueprint Clerk, Brand Recorder, Card Filer, Claims Clerk, Classification Clerk, Clerk, Clerk Typist, Computer Aide, Computer Tape Librarian, Credit Card Clerk, Cut File Clerk, Cut Filer, Death Surveys Coder, Document Clerk.
References
- U.S. Bureau of Labor Statistics, Occupational Employment and Wage Statistics — https://www.bls.gov/oes/
- O*NET Online — https://www.onetonline.org/
- BLS Employment Projections — https://www.bls.gov/emp/
- O*NET-SOC code: 43-4071.00
Course Advisor provides higher-education, college and university, degree, program, career, salary, and other helpful information to students, faculty, institutions, and other internet audiences. Presented information and data are subject to change. Inclusion on this website does not imply or represent a direct relationship with the company, school, or brand. Information, though believed correct at time of publication, may not be correct, and no warranty is provided. Contact the schools to verify any information before relying on it. Financial aid may be available for those who qualify. The displayed options may include sponsored or recommended results, not necessarily based on your preferences.
© Course Advisor – All Rights Reserved.