Education Administrators, All Other in District of Columbia
Thinking about a career as an Education Administrators, All Other in District of Columbia? Below are the key facts. All education administrators not listed separately.
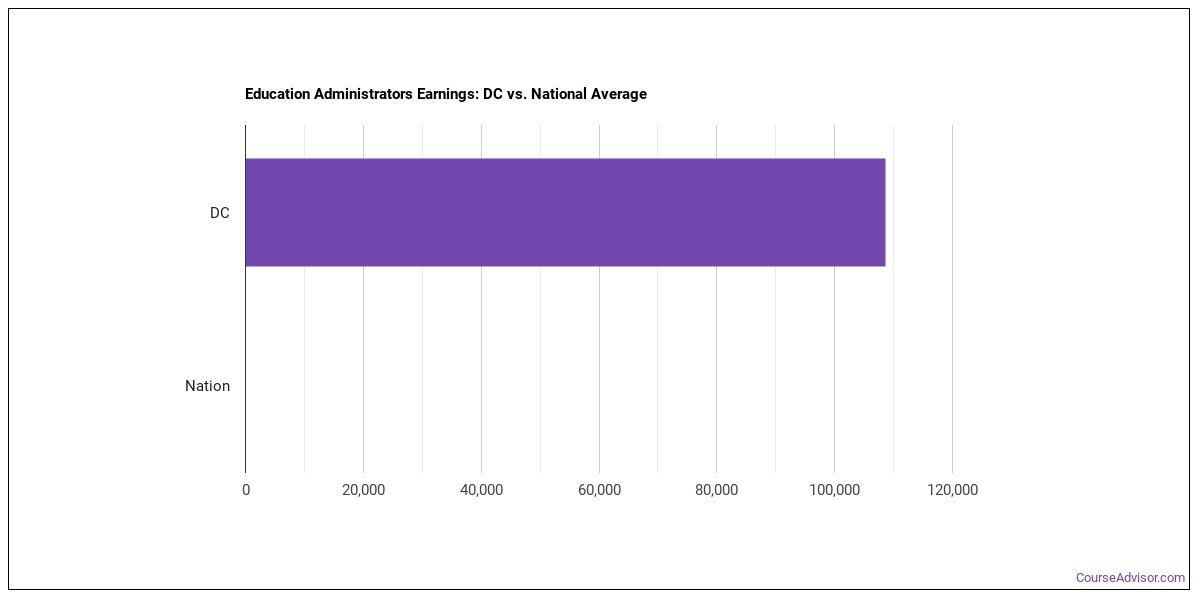
What do Education Administrators, All Other Make in District of Columbia?
For education administrators, all other working in District of Columbia, wages run about $133,680 per year (or roughly $64.27/hour).Annual wages span from $67,680 at the 10th percentile to $185,810 at the 90th percentile.
| Wage Statistic | Annual | Hourly |
|---|---|---|
| 10th percentile | $67,680 | $32.54 |
| 25th percentile | $99,060 | $47.62 |
| Median (50th) | $133,680 | $64.27 |
| 75th percentile | $157,980 | $75.95 |
| 90th percentile | $185,810 | $89.33 |

The location quotient — a measure of how concentrated this occupation is in District of Columbia relative to the national average — is 3.64, suggesting that education administrators, all other are more concentrated here than the national average.
National Wage Comparison
Nationally, education administrators, all other earn a median of $91,340 per year ($43.91/hour), exceeding the District of Columbia median.
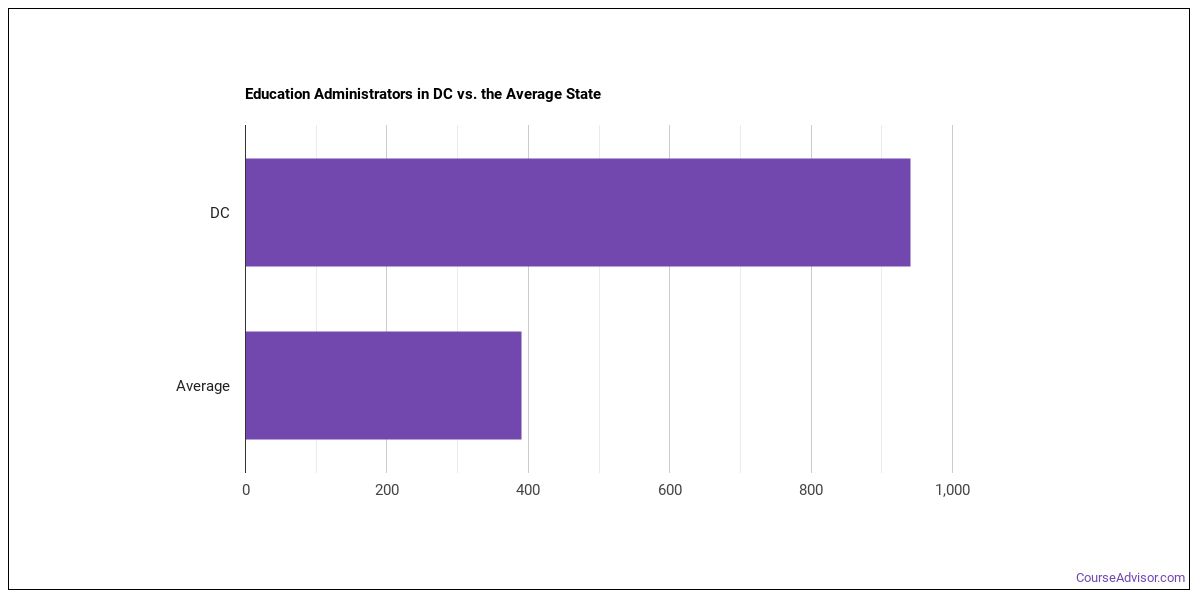
Employment Outlook
Nationally, total employment in this occupation is 236,264 education administrators, all other in the U.S.. In District of Columbia alone, approximately 890 people work in this role. That puts the state above the typical state, which employs around 440 education administrators, all other.

Top District of Columbia Metros for Education Administrators, All Other
These are the District of Columbia metros with the most education administrators, all other in District of Columbia.
| Metro Area | Number Employed | Annual Median Salary |
|---|---|---|
| Washington-Arlington-Alexandria, DC-VA-MD-WV | 2,650 | $126,460 |
Top States for Education Administrators, All Other Employment
View the states that employ the most education administrators, all other work.
| State | Number Employed |
|---|---|
| California | 11,110 |
| Texas | 4,210 |
| New York | 2,820 |
| Georgia | 2,730 |
| Ohio | 1,830 |
| Illinois | 1,650 |
| North Carolina | 1,440 |
| Virginia | 1,260 |
| Colorado | 1,060 |
| Massachusetts | 1,030 |
| Minnesota | 950 |
| Michigan | 910 |
| Washington | 900 |
| District of Columbia | 890 |
| Pennsylvania | 890 |
| Arkansas | 710 |
| Tennessee | 680 |
| Connecticut | 610 |
| Oregon | 580 |
| New Jersey | 570 |
Highest-Paying States for Education Administrators, All Other
These states pay the most for education administrators, all other.
| State | Annual Median Salary |
|---|---|
| District of Columbia | $133,680 |
| Guam | $122,010 |
| Kansas | $115,520 |
| Virginia | $115,340 |
| Maryland | $113,790 |
| Tennessee | $103,020 |
| Delaware | $102,070 |
| Colorado | $100,110 |
| Puerto Rico | $98,780 |
| Connecticut | $97,330 |
What Major Will Prepare You For This Career?
Related college programs include:
- Educational Administration
- Business Administration & Management
Featured schools near , edit
Also Known As
Apprenticeship Consultant, Apprenticeship Representative, Area Supervisor, Attache, Community Health Nursing Educational Director, Correctional Institution Education Supervisor, Director of Extension Work, Director of Health Education, Director of Professional Services, Director of Research, Director of Research and Development, Director of Vocational Training, Director of in Service Education, Division Chief, Education Director.
References
- U.S. Bureau of Labor Statistics, Occupational Employment and Wage Statistics — https://www.bls.gov/oes/
- O*NET Online — https://www.onetonline.org/
- BLS Employment Projections — https://www.bls.gov/emp/
- O*NET-SOC code: 11-9039.00
Course Advisor provides higher-education, college and university, degree, program, career, salary, and other helpful information to students, faculty, institutions, and other internet audiences. Presented information and data are subject to change. Inclusion on this website does not imply or represent a direct relationship with the company, school, or brand. Information, though believed correct at time of publication, may not be correct, and no warranty is provided. Contact the schools to verify any information before relying on it. Financial aid may be available for those who qualify. The displayed options may include sponsored or recommended results, not necessarily based on your preferences.
© Course Advisor – All Rights Reserved.