Administrative Services Managers in Michigan
Thinking about a career as an Administrative Services Managers in Michigan? Below are the key facts. Plan, direct, or coordinate one or more administrative services of an organization, such as records and information management, mail distribution, and other office support services. Medical records administrators are included in “Medical and Health Services Managers” (11-9111). Excludes “Facilities Managers” (11-3013) and “Purchasing Managers” (11-3061).
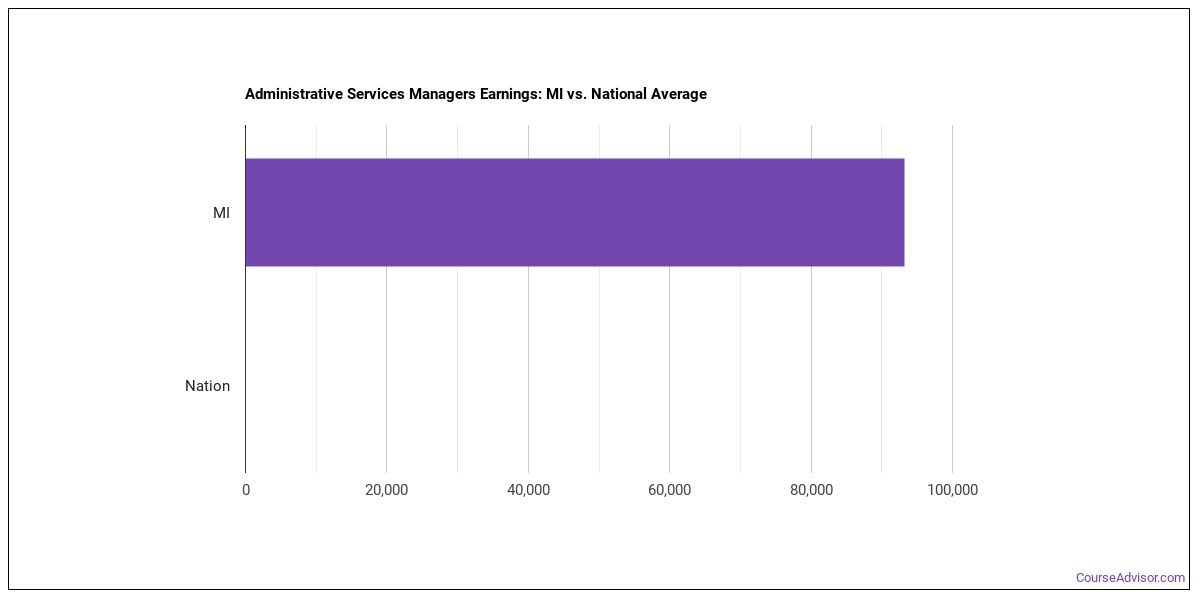
What do Administrative Services Managers Make in Michigan?
The administrative services managers working in Michigan, the typical annual salary is $105,290 per year (or about $50.62/hour).Pay can range from $64,510 at the 10th percentile to $158,430 at the 90th percentile.
| Wage Statistic | Annual | Hourly |
|---|---|---|
| 10th percentile | $64,510 | $31.01 |
| 25th percentile | $81,170 | $39.02 |
| Median (50th) | $105,290 | $50.62 |
| 75th percentile | $128,330 | $61.70 |
| 90th percentile | $158,430 | $76.17 |

The location quotient — a measure of how concentrated this occupation is in Michigan compared to the national average — is 1.01.
National Wage Comparison
Nationally, administrative services managers earn a median of $158,084 per year ($76.00/hour), lower than the Michigan median.
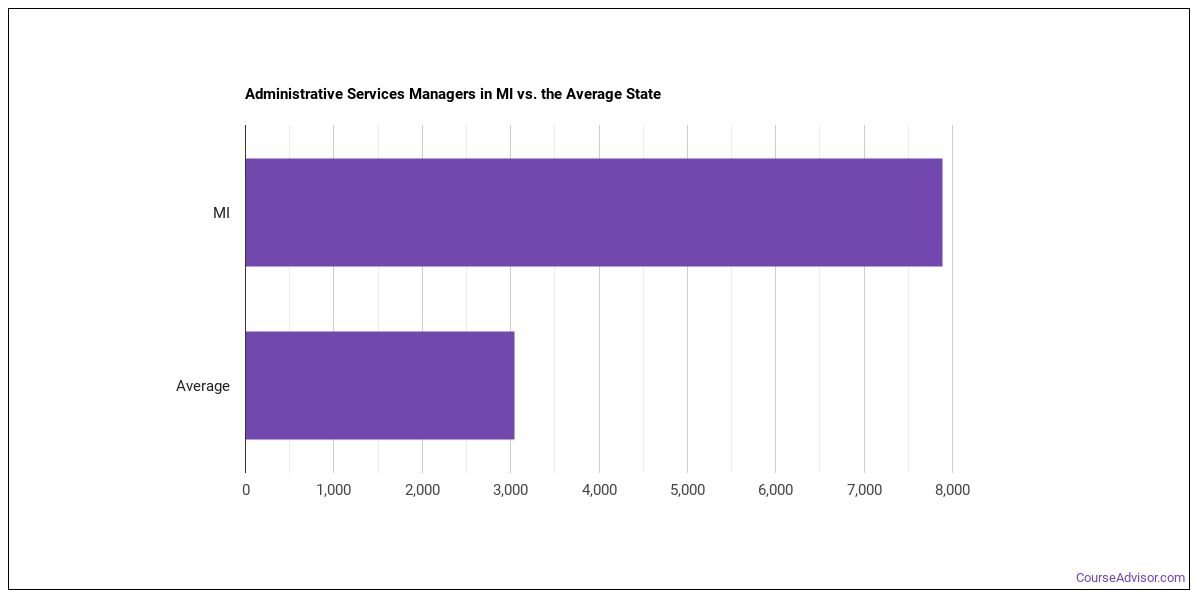
Employment Outlook
Nationally, total employment in this occupation is 390,726 administrative services managers nationwide. In Michigan alone, about 7,340 people work in this role. That’s more than the typical state, which employs around 2,510 administrative services managers.

Top Michigan Metros for Administrative Services Managers
The largest metro-area employers of administrative services managers in Michigan.
| Metro Area | Number Employed | Annual Median Salary |
|---|---|---|
| Detroit-Warren-Dearborn, MI | 2,890 | $103,460 |
| Lansing-East Lansing, MI | 1,530 | $117,840 |
| Grand Rapids-Wyoming-Kentwood, MI | 730 | $99,360 |
| Ann Arbor, MI | 400 | $109,510 |
| Kalamazoo-Portage, MI | 190 | $105,480 |
| Flint, MI | 170 | $92,580 |
| Niles, MI | 80 | $99,840 |
| Traverse City, MI | 80 | $99,580 |
| Battle Creek, MI | 70 | $103,460 |
| Jackson, MI | 70 | $113,320 |
| Saginaw, MI | 70 | $94,290 |
| Midland, MI | 60 | $118,910 |
| Muskegon-Norton Shores, MI | 50 | $97,660 |
| Monroe, MI | 30 | $89,420 |
Top States for Administrative Services Managers Employment
View the states that employ the most administrative services managers work.
| State | Number Employed |
|---|---|
| California | 40,580 |
| Texas | 23,370 |
| Florida | 15,110 |
| New York | 14,140 |
| Illinois | 11,570 |
| New Jersey | 10,050 |
| Massachusetts | 9,250 |
| Georgia | 8,850 |
| Tennessee | 8,740 |
| Ohio | 7,500 |
| North Carolina | 7,490 |
| Michigan | 7,340 |
| Arizona | 6,310 |
| Minnesota | 6,010 |
| Indiana | 5,940 |
| Pennsylvania | 5,760 |
| Wisconsin | 4,920 |
| Missouri | 4,650 |
| Maryland | 4,560 |
| Oregon | 3,610 |
Highest-Paying States for Administrative Services Managers
Where administrative services managers earn the most: administrative services managers.
| State | Annual Median Salary |
|---|---|
| Colorado | $145,650 |
| Delaware | $138,410 |
| New Jersey | $137,210 |
| Minnesota | $135,050 |
| Washington | $133,910 |
| New York | $132,490 |
| Connecticut | $130,930 |
| Tennessee | $126,670 |
| Virginia | $125,830 |
| District of Columbia | $125,820 |
Skills
Key administrative services managers skills, rated on an importance scale of 0 to 5:
Knowledge Areas
Key knowledge areas for this occupation, rated on an importance scale of 0 to 5:
Abilities
The abilities that matter most for administrative services managers, rated on an importance scale of 0 to 5:
Daily Tasks
Administrative Services Managers typically:
- Prepare and review operational reports and schedules to ensure accuracy and efficiency.
- Set goals and deadlines for the department.
- Acquire, distribute and store supplies.
- Analyze internal processes and recommend and implement procedural or policy changes to improve operations, such as supply changes or the disposal of records.
- Conduct classes to teach procedures to staff.
- Plan, administer, and control budgets for contracts, equipment, and supplies.
- Hire and terminate clerical and administrative personnel.
- Direct or coordinate the supportive services department of a business, agency, or organization.
- Communicate with and provide guidance for external vendors and service providers to ensure the organization, department, or work unit's business needs are met.
- Develop operational standards and procedures for the work unit or department.
- Establish work procedures or schedules to organize the daily work of administrative staff.
- Learn to operate new office technologies as they are developed and implemented.
Work Activities
- Getting Information
- Communicating with Supervisors, Peers, or Subordinates
- Organizing, Planning, and Prioritizing Work
- Making Decisions and Solving Problems
- Scheduling Work and Activities
- Establishing and Maintaining Interpersonal Relationships
- Working with Computers
- Performing Administrative Activities
- Documenting/Recording Information
- Coordinating the Work and Activities of Others
- Guiding, Directing, and Motivating Subordinates
- Identifying Objects, Actions, and Events
Tools & Technology
Technologies frequently used: Hot technologies: Adobe Acrobat, Atlassian JIRA, Autodesk AutoCAD In-demand technologies: Microsoft Excel
What Major Will Prepare You For This Career?
Programs that train for this career include:
- Business Administration & Management
- Business & Commerce
- Health/Medical Admin Services
- Veterinary Administrative Services
Featured schools near , edit
Related Careers
Careers similar to administrative services managers include:
- Facilities Managers
- Human Resources Managers
- Medical and Health Services Managers
- Social and Community Service Managers
- Compliance Managers
- Human Resources Specialists
Also Known As
Administration Director, Administrative Coordinator, Administrative Director, Administrative Manager, Administrative Officer, Administrative Services Manager, Administrator, Business Administrator, Business Coordinator, Business Manager, Business Office Director, Business Office Manager, Business Unit Manager, Operations Administrator, Records Management Director.
References
- U.S. Bureau of Labor Statistics, Occupational Employment and Wage Statistics — https://www.bls.gov/oes/
- O*NET Online — https://www.onetonline.org/
- BLS Employment Projections — https://www.bls.gov/emp/
- O*NET-SOC code: 11-3012.00
Course Advisor provides higher-education, college and university, degree, program, career, salary, and other helpful information to students, faculty, institutions, and other internet audiences. Presented information and data are subject to change. Inclusion on this website does not imply or represent a direct relationship with the company, school, or brand. Information, though believed correct at time of publication, may not be correct, and no warranty is provided. Contact the schools to verify any information before relying on it. Financial aid may be available for those who qualify. The displayed options may include sponsored or recommended results, not necessarily based on your preferences.
© Course Advisor – All Rights Reserved.