Political Science & Government Schools in Washington
Featured schools near , edit

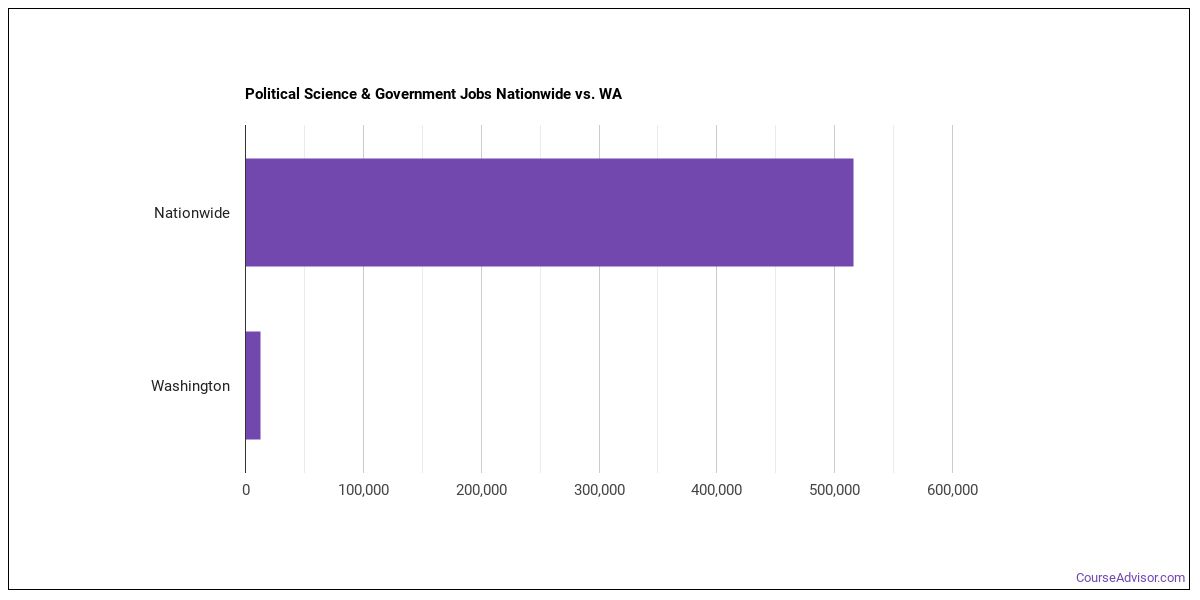
Jobs for Political Science & Government Grads in Washington
There are 27,200 people in the state and 1,787,880 people in the nation working in Political Science jobs.
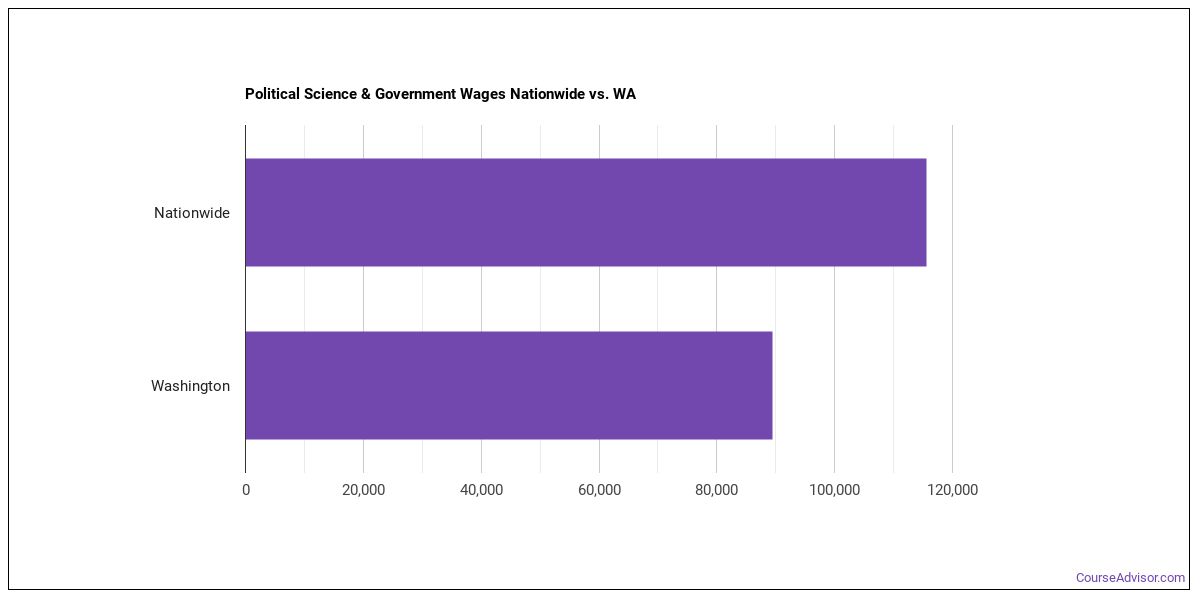
Wages for Political Science & Government Jobs in Washington
Political Science grads earn an average of $128,556 in the state and $101,838 nationwide.
Most Popular Political Science & Government Programs in WA
There are 3 colleges in Washington that offer Political Science degrees in our data. Learn about the most popular 3 below:

One year after graduating, alumni of this school earn a median of $53,990 a year. About 43% of those who apply are admitted. 95% of full-time students return after their first year.
Graduates earn a median salary of $49,447 in their first year after graduation. The school admits about 85% of applicants. 80% of full-time students return after their first year.
Graduates earn a median salary of $35,723 in their first year after graduation. With an admission rate of 91%, getting in takes some planning. 80% of full-time students return after their first year.
Political Science & Government Careers in WA
Some of the careers Political Science majors go into include:
| Job Title | Nationwide Job Growth | Nationwide Median Salary |
|---|---|---|
| Political Science Teachers, Postsecondary | — | $66,472 |
| Secondary School Teachers, Except Special and Career/Technical Education | — | $77,927 |
| Managers, All Other | — | $95,684 |
| Compliance Managers | — | $117,178 |
| Loss Prevention Managers | — | $165,723 |
| Political Scientists | — | $71,521 |
| Regulatory Affairs Managers | — | $77,828 |
| Economics Teachers, Postsecondary | — | $69,831 |
| Wind Energy Operations Managers | — | $122,567 |
| Brownfield Redevelopment Specialists and Site Managers | — | $99,321 |
| Wind Energy Development Managers | — | $169,952 |
| Social Science Research Assistants | — | $41,630 |
Related Majors in Washington
Below are some popular majors that are similar to Political Science.
| Major | Annual Graduates Nationwide |
|---|---|
| Economics | 45,628 |
| Sociology | 31,380 |
| General Social Sciences | 17,510 |
| International Relations & Security | 13,035 |
| Anthropology | 10,768 |
| Criminology | 10,365 |
| Geography & Cartography | 7,105 |
| Other Social Sciences | 1,942 |
View all majors related to Political Science & Government
Explore Major by State
Alabama
Arkansas
Connecticut
Florida
Hawaii
Indiana
Kentucky
Maryland
Minnesota
Montana
New Hampshire
New York
Ohio
Pennsylvania
South Carolina
Texas
Virgin Islands
West Virginia
View Nationwide Political Science & Government Report
References
More about our data sources and methodologies.
Course Advisor provides higher-education, college and university, degree, program, career, salary, and other helpful information to students, faculty, institutions, and other internet audiences. Presented information and data are subject to change. Inclusion on this website does not imply or represent a direct relationship with the company, school, or brand. Information, though believed correct at time of publication, may not be correct, and no warranty is provided. Contact the schools to verify any information before relying on it. Financial aid may be available for those who qualify. The displayed options may include sponsored or recommended results, not necessarily based on your preferences.
© Course Advisor – All Rights Reserved.