Political Science Schools in Illinois
1,437 students earned Political Science degrees in Illinois in the 2022-2023 year.
In terms of popularity, Political Science is the 27th most popular major in the state out of a total 306 majors commonly available.
Featured Political Science & Government Programs
Learn about start dates, transferring credits, availability of financial aid, and more by contacting the universities below.
Gain a solid understanding of American political history, the current political landscape, and the major political parties with this online bachelor's from Southern New Hampshire University.
Education Levels of Political Science Majors in Illinois
Political Science majors in the state tend to have the following degree levels:
| Education Level | Number of Grads |
|---|---|
| Bachelor’s Degree | 1,291 |
| Master’s Degree | 113 |
| Doctor’s Degree (Research / Scholarship) | 33 |
| Doctor’s Degree (Professional Practice) | 33 |
| Doctor’s Degree (Other) | 33 |
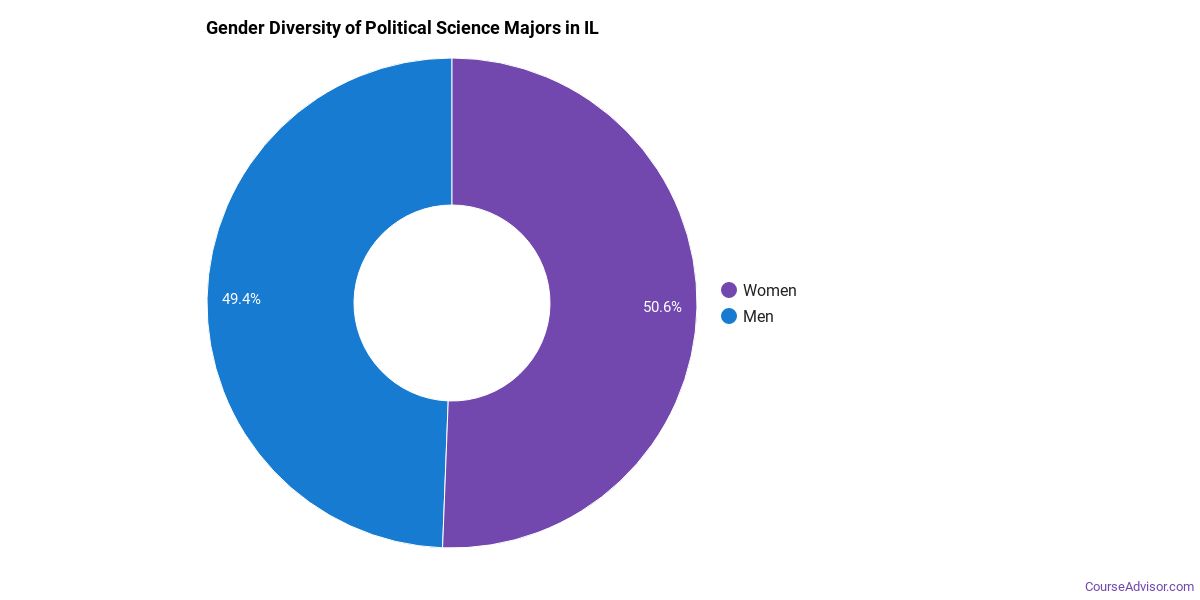
Gender Distribution
In Illinois, a political science major is more popular with women than with men.
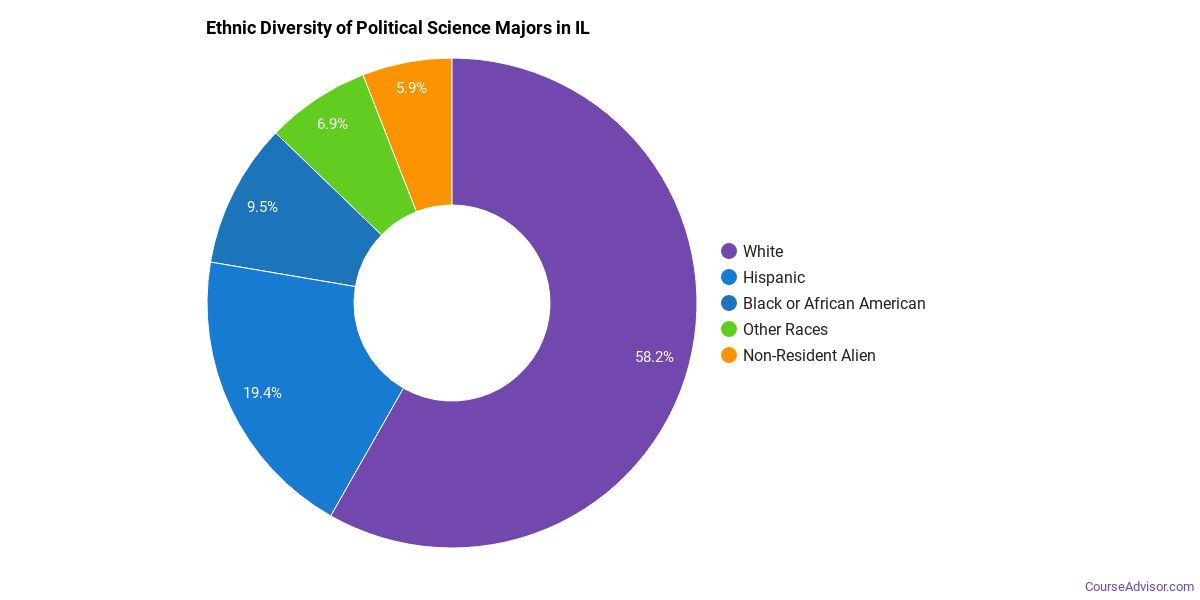
Racial Distribution
The racial distribution of political science majors in Illinois is as follows:
- Asian: 6.2%
- Black or African American: 9.5%
- Hispanic or Latino: 19.7%
- White: 52.9%
- Non-Resident Alien: 5.5%
- Other Races: 6.2%
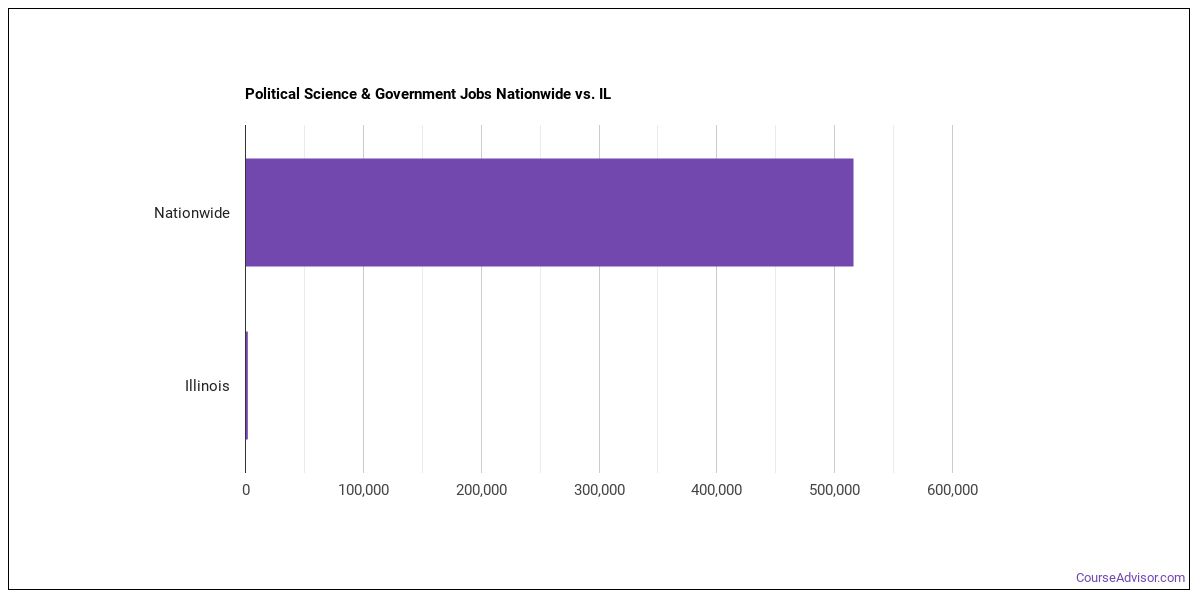
Jobs for Political Science Grads in Illinois
There are 1,490 people in the state and 515,790 people in the nation working in political science jobs.
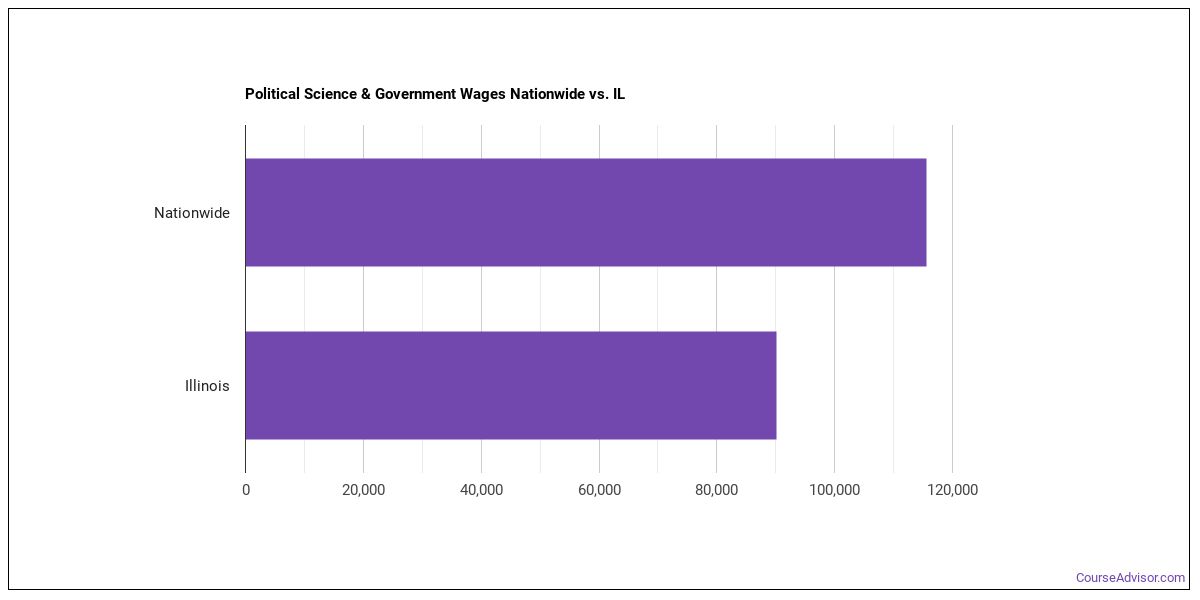
Wages for Political Science Jobs in Illinois
Political Science grads earn an average of $90,080 in the state and $115,590 nationwide.
Most Popular Political Science Programs in IL
There are 10 colleges in Illinois that offer political science degrees. Learn about the most popular 10 below:

21 to 1 is the student to faculty ratio. 73% of the teachers are full time. Students who attend this public school pay an average net price of $16,109.
Request Information
The average student takes 4.13 years to complete their degree at Loyola Chicago. This private institution charges an average net price of $35,555. 50% of the teachers are full time.
Request Information
Seeking financial aid? At this school, 58% of students receive it. 81% of the teachers are full time. Students enjoy a student to faculty ratio of 6 to 1.
Request Information
This private institution charges an average net price of $20,531. Most students complete their degree in 4.07 years. 85% of the teachers are full time.
Request Information
99% of students are awarded financial aid at this school. The student to faculty ratio is 17 to 1. Most students complete their degree in 4.21 years.
Request Information
Most students complete their degree in 4.51 years. 71% of the teachers are full time. Students enjoy a student to faculty ratio of 18 to 1.
Request Information
99% of students are awarded financial aid at this school. Of all the teachers who work at the school, 70% are considered full time. The student to faculty ratio is 14 to 1.
Request Information
It takes the average student 4.32 years to graduate. Of all the teachers who work at the school, 76% are considered full time. 98% of students get financical aid.
Request Information
98% of students get financical aid. The full-time teacher rate is 65%. This public school has an average net price of $11,807.
Request Information
Students who attend this public school pay an average net price of $12,388. Of all the teachers who work at the school, 76% are considered full time. 100% of students are awarded financial aid at this school.
Request InformationRelated Majors in Illinois
Below are some popular majors in the state that are similar to political science.
| Major | Annual Graduates in IL |
|---|---|
| Economics | 2,155 |
| Sociology | 841 |
| International Relations & Security | 389 |
| Anthropology | 288 |
| General Social Sciences | 196 |
| Geography & Cartography | 191 |
| Sociology & Anthropology | 44 |
| Other Social Sciences | 32 |
View all majors related to Political Science
Explore Major by State
Alabama
Arkansas
Connecticut
Florida
Idaho
Iowa
Louisiana
Massachusetts
Mississippi
Nebraska
New Jersey
North Carolina
Oklahoma
Rhode Island
Tennessee
Vermont
West Virginia
View Nationwide Political Science Report
References
- College Factual
- National Center for Education Statistics
- O*NET Online
- Image Credit: By UKWiki at English Wikipedia under License
More about our data sources and methodologies.
Course Advisor provides higher-education, college and university, degree, program, career, salary, and other helpful information to students, faculty, institutions, and other internet audiences. Presented information and data are subject to change. Inclusion on this website does not imply or represent a direct relationship with the company, school, or brand. Information, though believed correct at time of publication, may not be correct, and no warranty is provided. Contact the schools to verify any information before relying on it. Financial aid may be available for those who qualify. The displayed options may include sponsored or recommended results, not necessarily based on your preferences.
© Course Advisor – All Rights Reserved.