Social Sciences Schools in Illinois
6,281 Social Sciences students earned their degrees in the state in 2022-2023.
As a degree choice, Social Sciences is the 9th most popular major in the state.
Education Levels of Social Sciences Majors in Illinois
Social Sciences majors in the state tend to have the following degree levels:
| Education Level | Number of Grads |
|---|---|
| Bachelor’s Degree | 4,509 |
| Master’s Degree | 1,380 |
| Doctor’s Degree (Research / Scholarship) | 228 |
| Doctor’s Degree (Professional Practice) | 228 |
| Doctor’s Degree (Other) | 228 |
| Post-Master’s Certificate | 148 |
| Postbaccalaureate Certificate | 148 |
| Award Taking Less Than 1 Year | 16 |
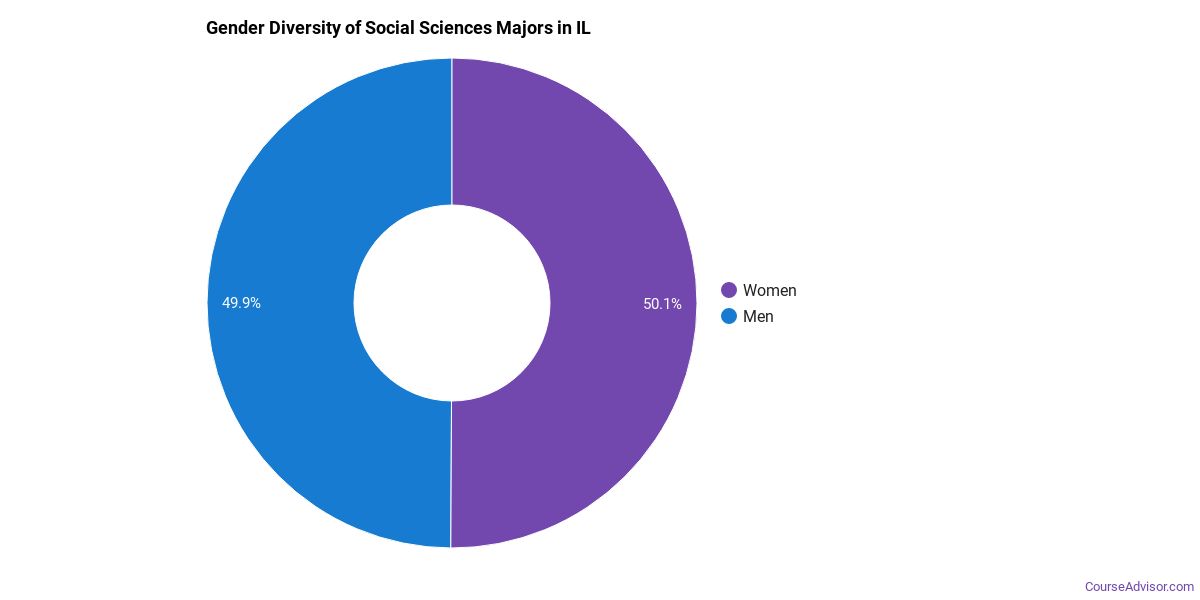
Gender Distribution
In Illinois, a social sciences major is more popular with women than with men.
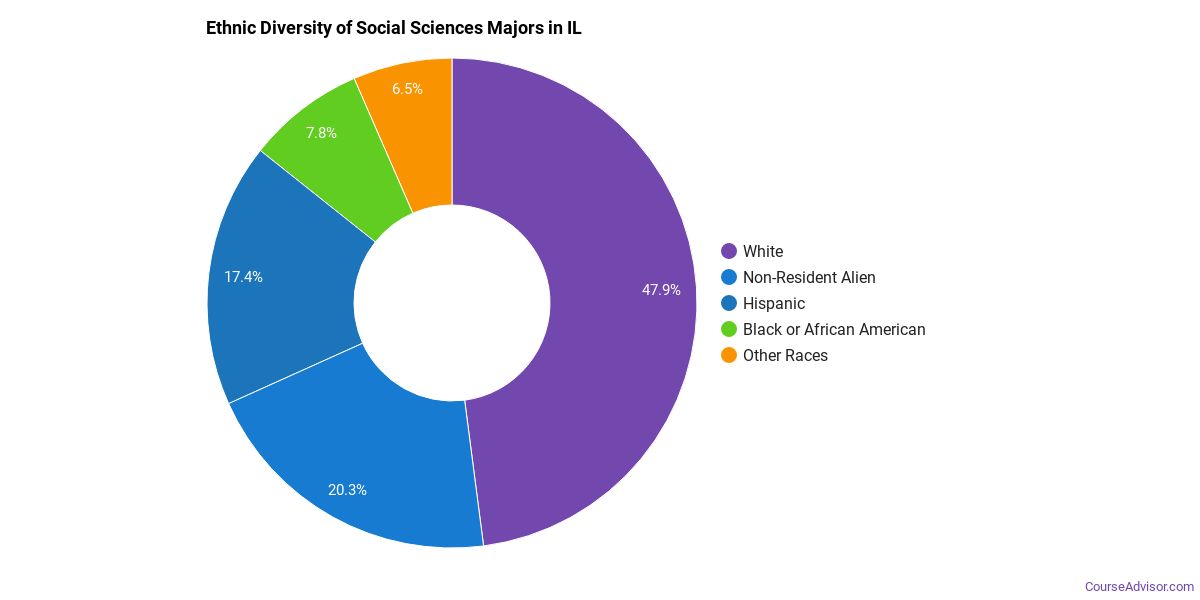
Racial Distribution
The racial distribution of social sciences majors in Illinois is as follows:
- Asian: 9.9%
- Black or African American: 6.8%
- Hispanic or Latino: 15.5%
- White: 40.6%
- Non-Resident Alien: 21.6%
- Other Races: 5.6%
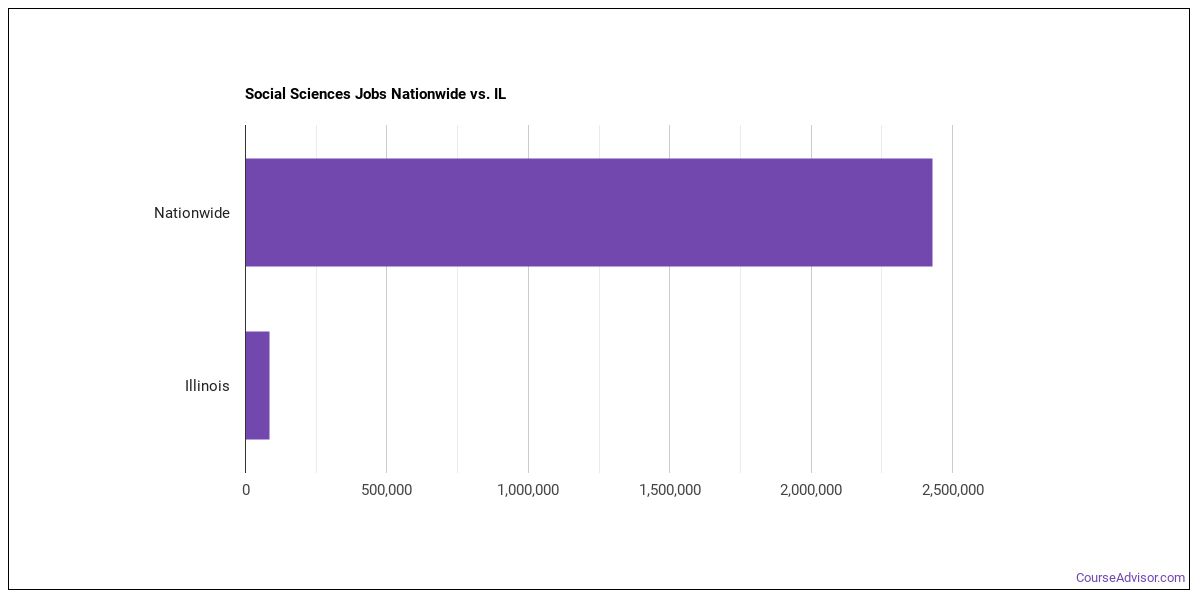
Jobs for Social Sciences Grads in Illinois
In this state, there are 84,070 people employed in jobs related to a social sciences degree, compared to 2,427,650 nationwide.
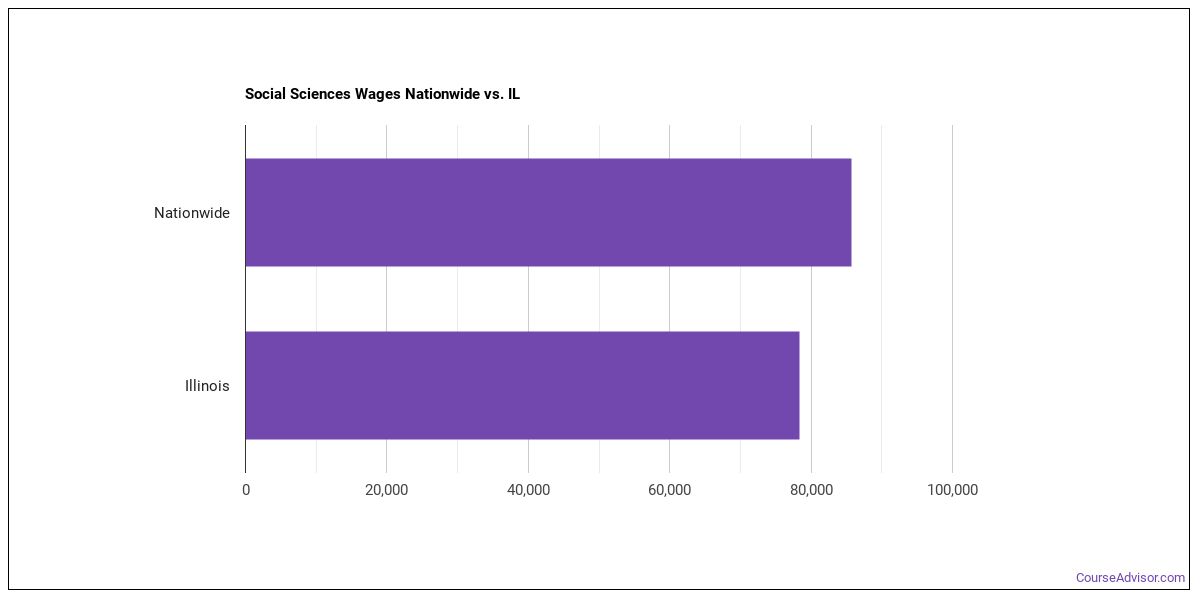
Wages for Social Sciences Jobs in Illinois
A typical salary for a social sciences grad in the state is $78,290, compared to a typical salary of $85,750 nationwide.
Most Popular Social Sciences Programs in IL
There are 10 colleges in Illinois that offer social sciences degrees. Learn about the most popular 10 below:

This private institution charges an average net price of $20,531. Most students complete their degree in 4.07 years. 85% of the teachers are full time.
Request Information
21 to 1 is the student to faculty ratio. 73% of the teachers are full time. Students who attend this public school pay an average net price of $16,109.
Request Information
Seeking financial aid? At this school, 58% of students receive it. 81% of the teachers are full time. Students enjoy a student to faculty ratio of 6 to 1.
Request Information
Most students complete their degree in 4.51 years. 71% of the teachers are full time. Students enjoy a student to faculty ratio of 18 to 1.
Request Information
The average student takes 4.13 years to complete their degree at Loyola Chicago. This private institution charges an average net price of $35,555. 50% of the teachers are full time.
Request Information
99% of students are awarded financial aid at this school. The student to faculty ratio is 17 to 1. Most students complete their degree in 4.21 years.
Request Information
It takes the average student 4.32 years to graduate. Of all the teachers who work at the school, 76% are considered full time. 98% of students get financical aid.
Request Information
99% of students are awarded financial aid at this school. Of all the teachers who work at the school, 70% are considered full time. The student to faculty ratio is 14 to 1.
Request Information
A typical student attending SIUC will pay a net price of $16,729. 11 to 1 is the student to faculty ratio. Most students complete their degree in 4.40 years.
Request Information
Most students complete their degree in 4.08 years. Students enjoy a student to faculty ratio of 12 to 1. This private institution charges an average net price of $26,877.
Request InformationSocial Sciences Careers in IL
Some of the careers social sciences majors go into include:
| Job Title | IL Job Growth | IL Median Salary |
|---|---|---|
| Market Research Analysts and Marketing Specialists | 22% | $57,340 |
| Urban and Regional Planners | 10% | $69,770 |
| Anthropologists and Archeologists | 0% | $62,330 |
| Geographers | 0% | $0 |
| Geography Professors | -7% | $77,490 |
Related Majors in Illinois
Below are some popular majors in the state that are similar to social sciences.
| Major | Annual Graduates in IL |
|---|---|
| Liberal Arts & Humanities | 18,292 |
| Communication & Journalism | 4,261 |
| Theology & Religious Vocations | 1,796 |
| English Language & Literature | 1,599 |
| History | 974 |
| Family, Consumer & Human Sciences | 957 |
| Foreign Languages & Linguistics | 954 |
| Philosophy & Religious Studies | 562 |
View all majors related to Social Sciences
Explore Major by State
Alabama
Arkansas
Connecticut
Florida
Idaho
Iowa
Louisiana
Massachusetts
Mississippi
Nebraska
New Jersey
North Carolina
Oklahoma
Rhode Island
Tennessee
Vermont
West Virginia
View Nationwide Social Sciences Report
References
- College Factual
- National Center for Education Statistics
- O*NET Online
- Image Credit: By AndrГ© KГјnzelmann under License
More about our data sources and methodologies.
Course Advisor provides higher-education, college and university, degree, program, career, salary, and other helpful information to students, faculty, institutions, and other internet audiences. Presented information and data are subject to change. Inclusion on this website does not imply or represent a direct relationship with the company, school, or brand. Information, though believed correct at time of publication, may not be correct, and no warranty is provided. Contact the schools to verify any information before relying on it. Financial aid may be available for those who qualify. The displayed options may include sponsored or recommended results, not necessarily based on your preferences.
© Course Advisor – All Rights Reserved.