Southern Illinois University-Carbondale Science & Tech Programs
Southern Illinois University-Carbondale is a public institution located in Carbondale, IL. A Distant Town offers an ideal setting close to urban amenities.
Featured schools near , edit
Southern Illinois University-Carbondale Rankings
Southern Illinois University-Carbondale appears in the following rankings for science & tech programs at the bachelors level:
| Ranking | Rank | Among |
|---|---|---|
| Overall Quality | #32 of 188 | State — Illinois |
| Overall Quality | #99 of 719 | Region — Great Lakes |
| Overall Quality | #604 of 4,630 | Nationwide |
Where Is Southern Illinois University-Carbondale?
Get in touch with Southern Illinois University-Carbondale can be found below.
| Contact Details | |
|---|---|
| Address: | Lincoln Drive, Carbondale, IL 62901-4512 |
| Phone: | 6184532121 |
| Website: | siu.edu/ |
| Admissions: | admissions.siu.edu/ |
| Financial Aid: | fao.siu.edu/ |
How Do I Get Into Southern Illinois University-Carbondale?
You can apply to Southern Illinois University-Carbondale online at: https://admissions.siu.edu/apply
Southern Illinois University-Carbondale is classified as Least Selective (85%+) for admissions.
Admission Requirements for Southern Illinois University-Carbondale
Here’s what Southern Illinois University-Carbondale considers when reviewing applications:
| Requirement | Status |
|---|---|
| Secondary School Record | Required |
| Secondary School GPA | Required |
| Recommendations | Considered but not required |
| Admission Test Scores (SAT/ACT) | Considered but not required |
How Hard Is It To Get Into Southern Illinois University-Carbondale?
Southern Illinois University-Carbondale admits 87%, which makes it highly accessible. Be sure to prepare a complete application and prepare the application in full.
Of those admitted, 19% choose to enroll — a modest enrollment yield, suggesting many admitted students choose other institutions.
Average Test Scores
37% of admitted students submitted SAT scores and 8% submitted ACT scores.
When looking at the 25th through the 75th percentile of admitted students at Southern Illinois University-Carbondale, SAT Evidence-Based Reading and Writing scores ranged between 470 and 590. Math scores were between 430 and 570.
Selectivity by Gender
Selectivity numbers at Southern Illinois University-Carbondale vary modestly across gender.
| Gender | Applicants | Admitted | Acceptance Rate |
|---|---|---|---|
| Men | 4,385 | 3,721 | 85% |
| Women | 6,447 | 5,699 | 88% |
Can I Afford Southern Illinois University-Carbondale?
The average net price after aid at Southern Illinois University-Carbondale is $16,177. Your actual cost will depend on your family’s circumstances since net price varies by income group.
Tuition & Fees
| Category | Cost |
|---|---|
| In-State Tuition | $9,638 |
| In-State Fees | $3,696 |
| Out-of-State Tuition | $9,638 |
| Out-of-State Fees | $3,696 |
| Total In-State Tuition & Fees | $13,334 |
| Total Out-of-State Tuition & Fees | $13,334 |
Financial Aid
Counting all forms of financial assistance, 19% of students at Southern Illinois University-Carbondale receive some form of financial aid (1,580 students).
About 83% of students at Southern Illinois University-Carbondale receive grant or scholarship aid, averaging $13,341 per student.
39% of students receive federal Pell Grants, averaging $6,099.
Student Loan Debt
45% of Southern Illinois University-Carbondale undergraduates take out federal student loans, averaging $6,633 per year.
Southern Illinois University-Carbondale Undergraduate Student Diversity
There are 3,568 students enrolled at Southern Illinois University-Carbondale. Southern Illinois University-Carbondale is classified as a 10,000 - 19,999 institution by enrollment size. Its Carnegie Classification is Doctoral Universities: Higher Research Activity.
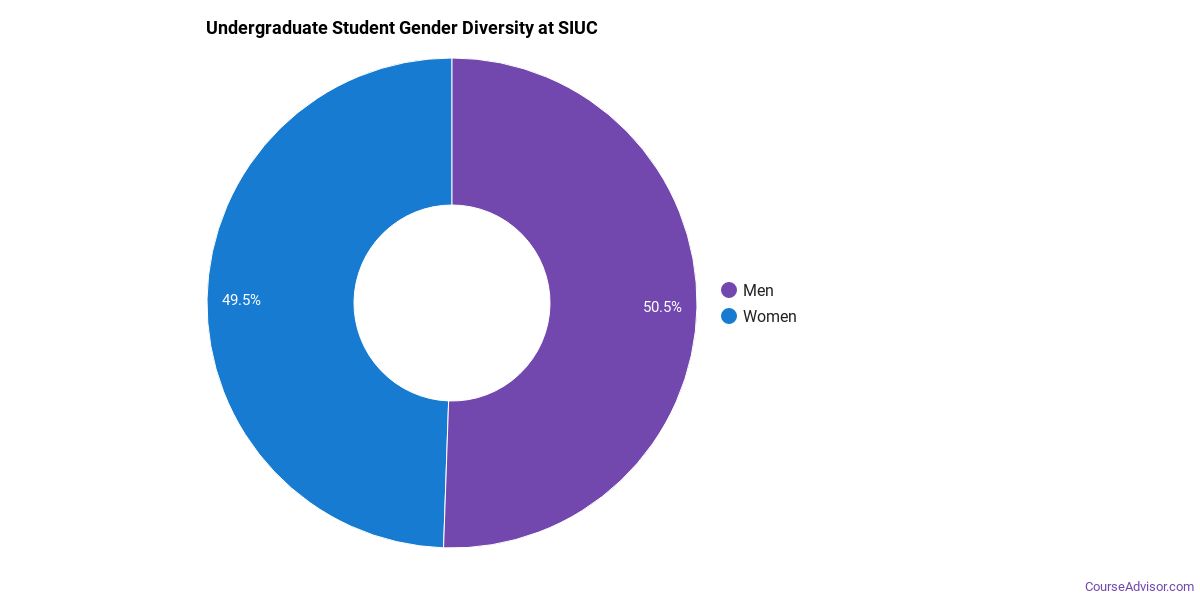
Gender Diversity
Of the 8,116 undergraduate students at Southern Illinois University-Carbondale, approximately 48% are male and 52% are female.
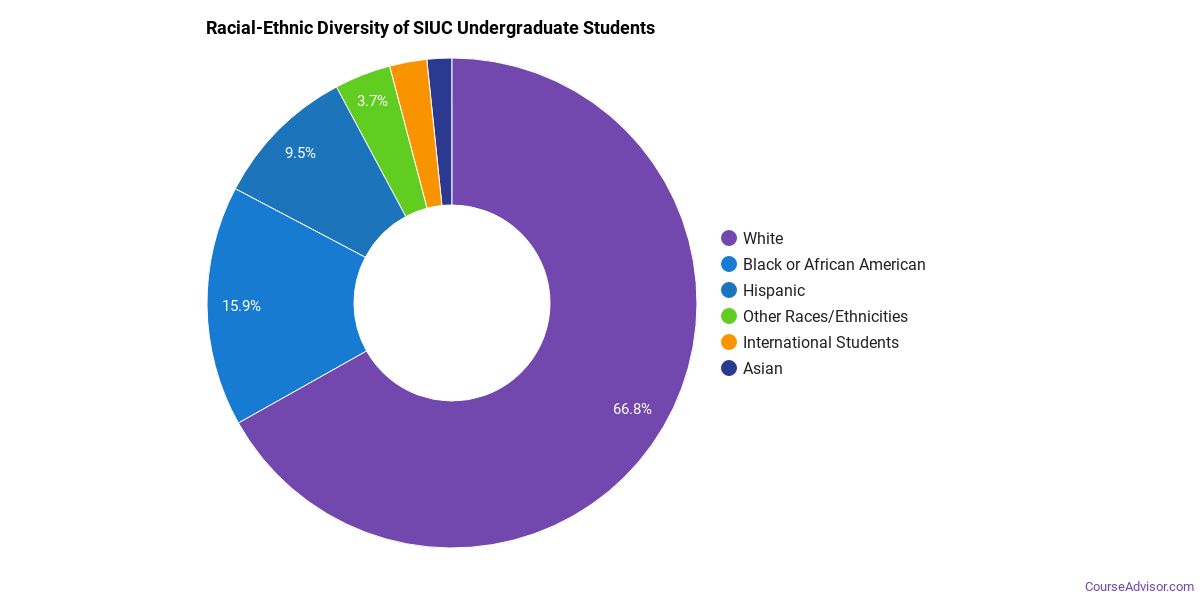
Racial-Ethnic Diversity
The racial-ethnic breakdown of Southern Illinois University-Carbondale undergraduate students is as follows.
| Race/Ethnicity | Number of Students |
|---|---|
| Asian | 137 |
| Black or African American | 1,404 |
| Hispanic | 827 |
| White | 5,242 |
| American Indian/Alaska Native | 16 |
| Native Hawaiian/Pacific Islander | 8 |
| Two or More Races | 316 |
| Non-Resident | 146 |
Geographic Diversity
The top 5 home states of first-time undergraduate students at Southern Illinois University-Carbondale break down as follows.

| State | First-Time UG Students |
|---|---|
| Illinois | 1,488 |
| Missouri | 76 |
| Indiana | 25 |
| Kentucky | 15 |
| Tennessee | 14 |
Additionally, approximately 1.8% of undergraduate students are non-resident from outside the United States.
Southern Illinois University-Carbondale Graduate Student Diversity
3,164 of Southern Illinois University-Carbondale’s students are in graduate programs. The highest graduate-level award offered is Doctor’s degree.
Gender Diversity (Graduate)
Among graduate students at Southern Illinois University-Carbondale, approximately 45% are male and 55% are female.

Racial-Ethnic Diversity (Graduate)
The racial-ethnic breakdown of Southern Illinois University-Carbondale graduate students is as follows.

| Race/Ethnicity | Number of Students |
|---|---|
| Asian | 126 |
| Black or African American | 370 |
| Hispanic | 177 |
| White | 1,689 |
| American Indian/Alaska Native | 9 |
| Native Hawaiian/Pacific Islander | 6 |
| Two or More Races | 79 |
| Non-Resident | 699 |
Online Learning at Southern Illinois University-Carbondale
Southern Illinois University-Carbondale provides remote learning paths for students who need flexibility.
3,022 undergraduate students at Southern Illinois University-Carbondale took at least one online class — of those, 1,492 took all of their classes online.
At the graduate level, 338 students took at least one online class and 780 took all classes online. Distance education is available at the undergraduate and graduate levels.
Science & Tech Programs at Southern Illinois University-Carbondale
These science & tech programs are offered at Southern Illinois University-Carbondale, with per-level degree counts in the most recent reporting year.
| Program | Bachelor’s | Master’s | Doctorate | Total |
|---|---|---|---|---|
| Architecture | 29 | 32 | — | 61 |
Academic Programs at Southern Illinois University-Carbondale
Southern Illinois University-Carbondale offers 31 distinct academic programs.
The highest level of award offered is Doctor’s degree.
Institutional Profile
Southern Illinois University-Carbondale has an open admission policy: No. Credit transfer:
- AP credits: Yes
- Dual enrollment credits: Yes
- Life experience credits: Implied no
References
More about our data sources and methodologies.
Course Advisor provides higher-education, college and university, degree, program, career, salary, and other helpful information to students, faculty, institutions, and other internet audiences. Presented information and data are subject to change. Inclusion on this website does not imply or represent a direct relationship with the company, school, or brand. Information, though believed correct at time of publication, may not be correct, and no warranty is provided. Contact the schools to verify any information before relying on it. Financial aid may be available for those who qualify. The displayed options may include sponsored or recommended results, not necessarily based on your preferences.
© Course Advisor – All Rights Reserved.