Basic Certificates in Social Sciences
Education Levels of Social Sciences Majors
During the most recent year for which data is available, 2,514 people earned their basic certificate in social sciences. The following table shows the number of diplomas awarded in social sciences at each degree level.
| Education Level | Number of Grads |
|---|---|
| Bachelor’s Degree | 140,768 |
| Associate Degree | 22,137 |
| Master’s Degree | 19,295 |
| Doctor’s Degree | 3,723 |
| Basic Certificate | 2,514 |
| Graduate Certificate | 2,108 |
| Undergraduate Certificate | 247 |
Earnings of Social Sciences Majors With Basic Certificates
We are unable to calculate the median earnings for social sciences majors with their basic certificate due to lack of data.
Student Debt
The data on debt ranges for social sciences majors who have their basic certificate is not available.
Student Diversity
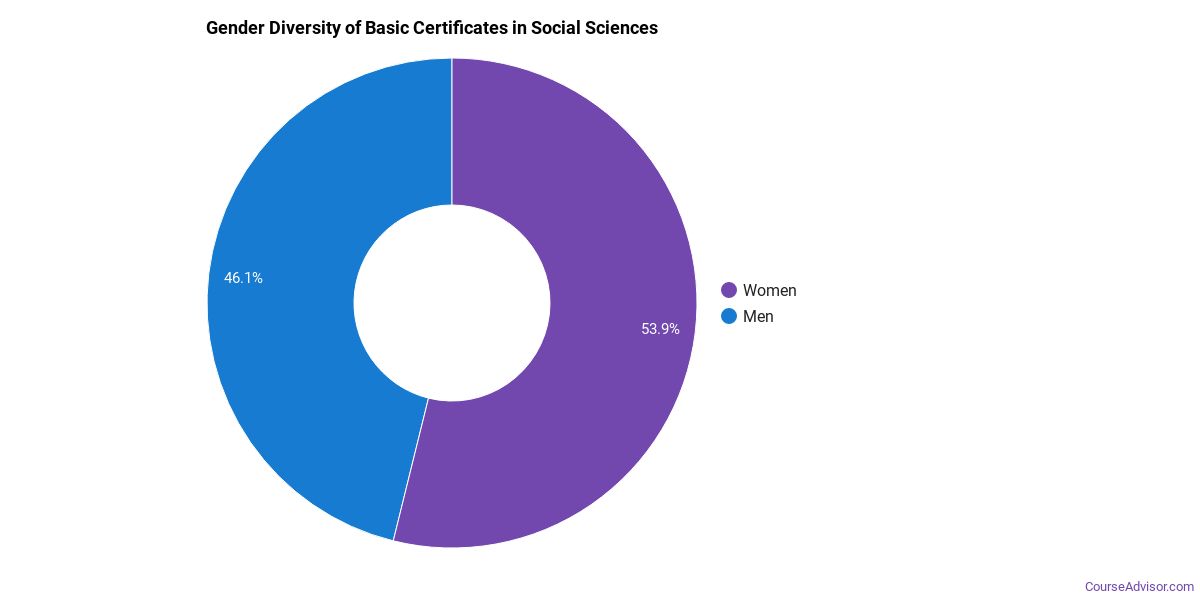
More women than men pursue their basic certificate in social sciences. About 56.0% of graduates with this degree are female.
| Gender | Number of Grads |
|---|---|
| Men | 1,107 |
| Women | 1,407 |
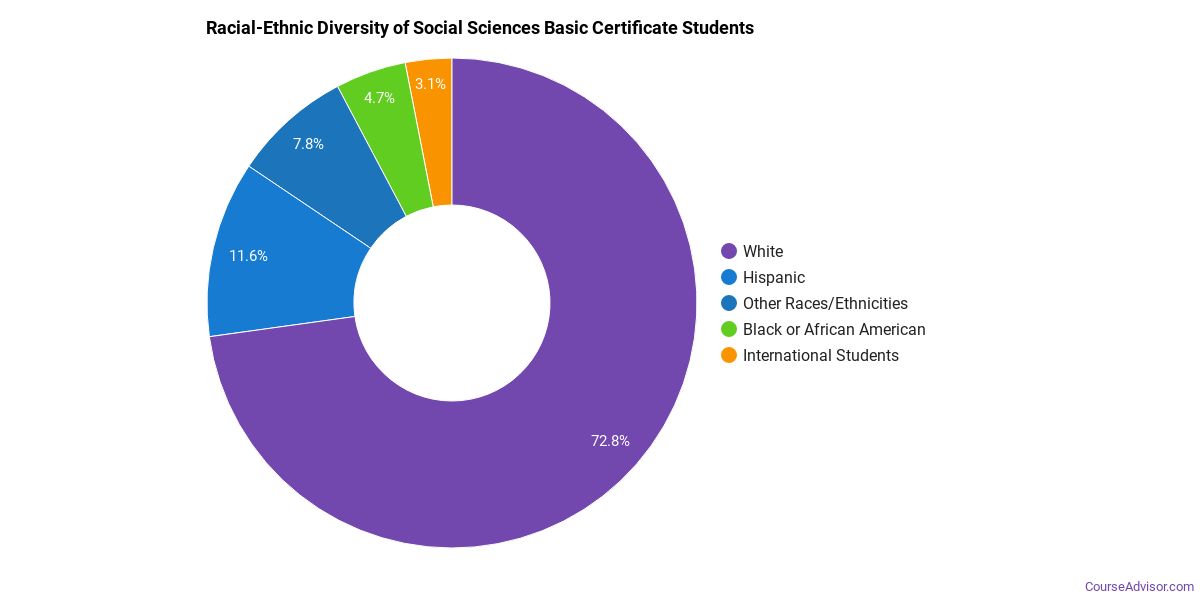
The racial-ethnic distribution of social sciences basic certificate students is as follows:
| Race/Ethnicity | Number of Grads |
|---|---|
| Asian | 123 |
| Black or African American | 86 |
| Hispanic or Latino | 296 |
| White | 1,761 |
| International Students | 50 |
| Other Races/Ethnicities | 198 |
Explore Major by State
Alabama
Arkansas
Connecticut
Florida
Idaho
Iowa
Louisiana
Massachusetts
Mississippi
Nebraska
New Jersey
North Carolina
Oklahoma
Rhode Island
Tennessee
Vermont
West Virginia
Related Majors
Below are some popular majors that are similar to social sciences that offer basic certificates.
| Major | Annual Degrees Awarded |
|---|---|
| Liberal Arts & Humanities | 23,983 |
| Family, Consumer & Human Sciences | 16,483 |
| Communication & Journalism | 3,716 |
| Foreign Languages & Linguistics | 3,377 |
| Ethnic, Culture & Gender Studies | 2,633 |
References
*The racial-ethnic minority student count is calculated by taking the total number of students and subtracting white students, international students, and students whose race/ethnicity was unknown. This number is then divided by the total number of students at the school to obtain the percentage of racial-ethnic minorities.
- College Factual
- National Center for Education Statistics
- O*NET Online
- Bureau of Labor Statistics
- Image Credit: By AndrГ© KГјnzelmann under License
More about our data sources and methodologies.
Course Advisor provides higher-education, college and university, degree, program, career, salary, and other helpful information to students, faculty, institutions, and other internet audiences. Presented information and data are subject to change. Inclusion on this website does not imply or represent a direct relationship with the company, school, or brand. Information, though believed correct at time of publication, may not be correct, and no warranty is provided. Contact the schools to verify any information before relying on it. Financial aid may be available for those who qualify. The displayed options may include sponsored or recommended results, not necessarily based on your preferences.
© Course Advisor – All Rights Reserved.