Basic Certificates in Area, Ethnic, Culture, & Gender Studies
Search Featured Area, Ethnic, Culture, & Gender Studies Programs
Learn about start dates, transferring credits, availability of financial aid, and more by contacting the universities below.
Explore societal similarities and differences as seen through cultural, biological, archaeological and linguistic lenses when you earn one of your degrees in anthropology from Southern New Hampshire University.

Gain a rich foundation of knowledge ranging from early history to modern times with this online bachelor's degree in history from Southern New Hampshire University.
The online Master of Arts in History degree program can deepen your understanding of how history is made.
Featured Area, Ethnic, Culture, & Gender Studies Programs
Learn about start dates, transferring credits, availability of financial aid, and more by contacting the universities below.
Explore societal similarities and differences as seen through cultural, biological, archaeological and linguistic lenses when you earn one of your degrees in anthropology from Southern New Hampshire University.
Gain a rich foundation of knowledge ranging from early history to modern times with this online bachelor's degree in history from Southern New Hampshire University.
The online Master of Arts in History degree program can deepen your understanding of how history is made.
Education Levels of Area, Ethnic, Culture, & Gender Studies Majors
During the most recent year for which data is available, 2,633 people earned their basic certificate in area, ethnic, culture, & gender studies. The following table shows the number of diplomas awarded in area, ethnic, culture, & gender studies at each degree level.
| Education Level | Number of Grads |
|---|---|
| Bachelor’s Degree | 8,669 |
| Basic Certificate | 2,633 |
| Master’s Degree | 1,931 |
| Associate Degree | 872 |
| Graduate Certificate | 609 |
| Doctor’s Degree | 449 |
| Undergraduate Certificate | 91 |
Earnings of Area, Ethnic, Culture, & Gender Studies Majors With Basic Certificates
At this time, we do not have the data to estimate the median earnings for this class of people.
Student Debt
We do not have the data to estimate the median debt for this class of people.
Student Diversity
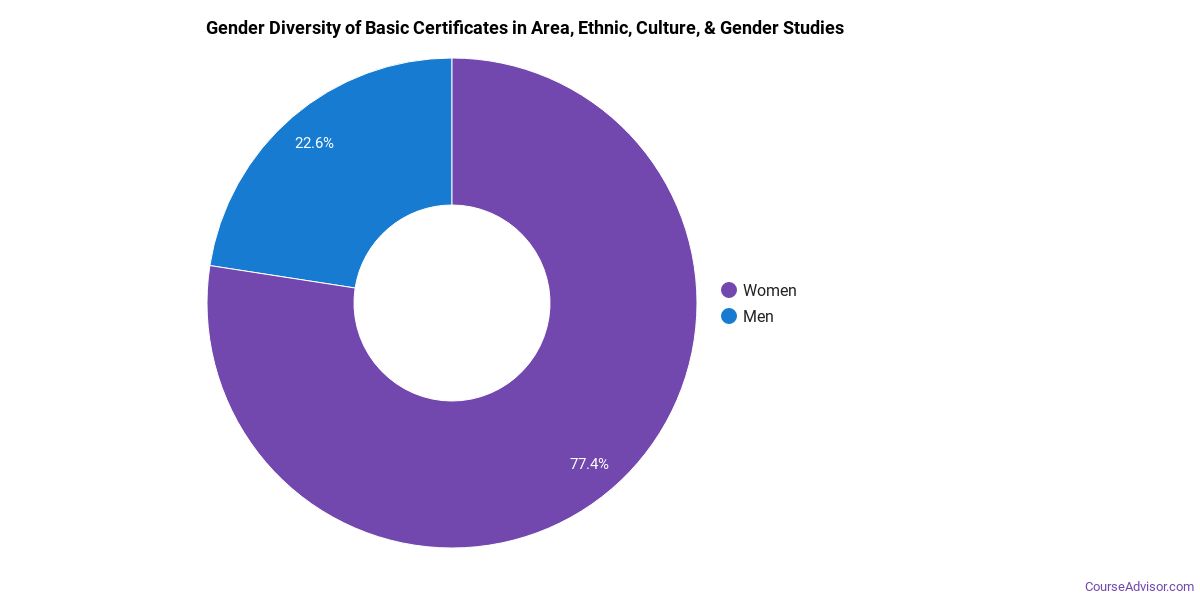
More women than men pursue their basic certificate in area, ethnic, culture, & gender studies. About 76.4% of graduates with this degree are female.
| Gender | Number of Grads |
|---|---|
| Men | 622 |
| Women | 2,011 |
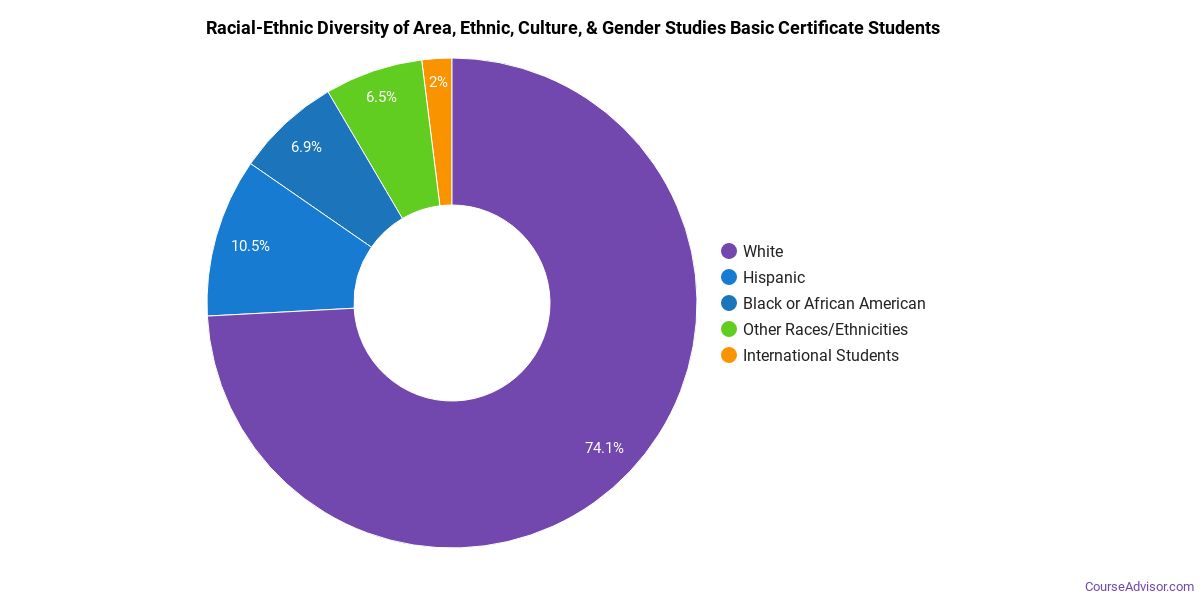
The racial-ethnic distribution of area, ethnic, culture, & gender studies basic certificate students is as follows:
| Race/Ethnicity | Number of Grads |
|---|---|
| Asian | 138 |
| Black or African American | 147 |
| Hispanic or Latino | 295 |
| White | 1,769 |
| International Students | 107 |
| Other Races/Ethnicities | 177 |
Related Programs
Learn about other programs related to Area, Ethnic, Culture, & Gender Studies that might interest you.
Explore societal similarities and differences as seen through cultural, biological, archaeological and linguistic lenses when you earn one of your degrees in anthropology from Southern New Hampshire University.
Gain a rich foundation of knowledge ranging from early history to modern times with this online bachelor's degree in history from Southern New Hampshire University.
The online Master of Arts in History degree program can deepen your understanding of how history is made.
Explore Major by State
Alabama
Arkansas
Connecticut
Florida
Idaho
Iowa
Louisiana
Massachusetts
Mississippi
Nebraska
New Jersey
North Carolina
Oklahoma
Rhode Island
Tennessee
Vermont
West Virginia
Related Majors
Below are some popular majors that are similar to area, ethnic, culture, & gender studies that offer basic certificates.
| Major | Annual Degrees Awarded |
|---|---|
| Liberal Arts & Humanities | 23,983 |
| Family, Consumer & Human Sciences | 16,483 |
| Communication & Journalism | 3,716 |
| Foreign Languages & Linguistics | 3,377 |
| Social Sciences | 2,514 |
References
*The racial-ethnic minority student count is calculated by taking the total number of students and subtracting white students, international students, and students whose race/ethnicity was unknown. This number is then divided by the total number of students at the school to obtain the percentage of racial-ethnic minorities.
- College Factual
- National Center for Education Statistics
- O*NET Online
- Bureau of Labor Statistics
- Image Credit: By G. Mützel under License
More about our data sources and methodologies.
Course Advisor provides higher-education, college and university, degree, program, career, salary, and other helpful information to students, faculty, institutions, and other internet audiences. Presented information and data are subject to change. Inclusion on this website does not imply or represent a direct relationship with the company, school, or brand. Information, though believed correct at time of publication, may not be correct, and no warranty is provided. Contact the schools to verify any information before relying on it. Financial aid may be available for those who qualify. The displayed options may include sponsored or recommended results, not necessarily based on your preferences.
© Course Advisor – All Rights Reserved.