Bachelor’s Degrees in History and Political Science
Featured schools near , edit
Education Levels of History and Political Science Majors
In 2020-2021, 47 bachelor's degrees were awarded to history and political science majors. This makes it the 305th most popular bachelor's degree program in the country.
The following table shows the number of diplomas awarded in history and political science at each degree level.
| Education Level | Number of Grads |
|---|---|
| Bachelor’s Degree | 47 |
| Basic Certificate | 14 |
| Master’s Degree | 4 |
| Associate Degree | 1 |
Earnings of History and Political Science Majors With Bachelor’s Degrees
We are unable to calculate the median earnings for history and political science majors with their bachelor's degree due to lack of data.
Student Debt
The data on debt ranges for history and political science majors who have their bachelor's degree is not available.
Student Diversity
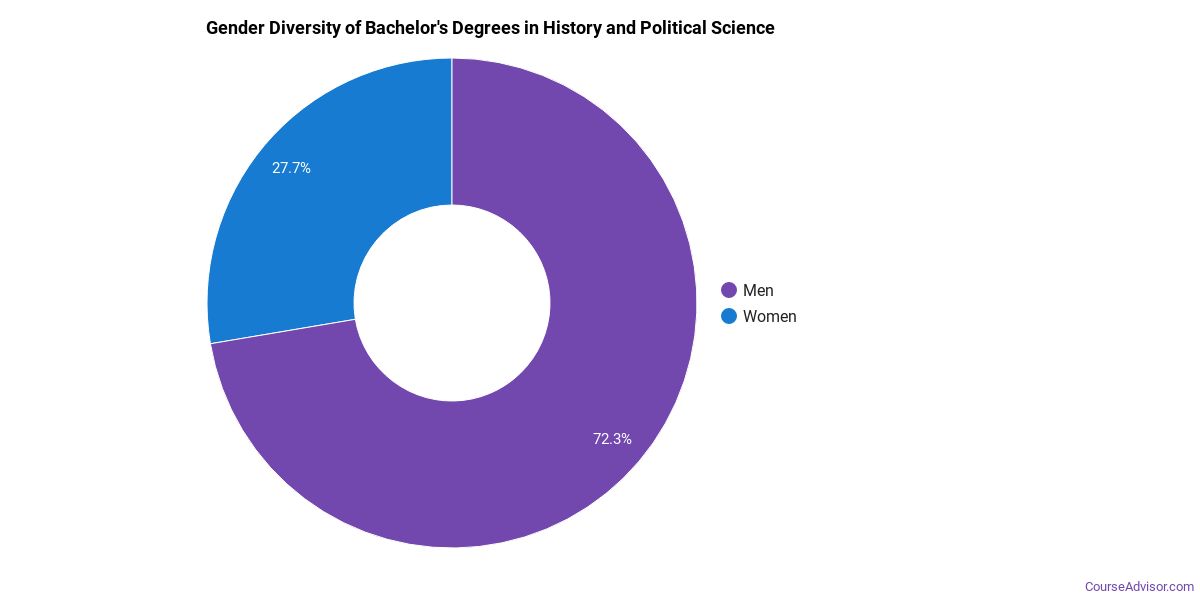
More men than women pursue bachelor's degrees in history and political science. About 72.3% of graduates in this field are male.
| Gender | Number of Grads |
|---|---|
| Men | 34 |
| Women | 13 |
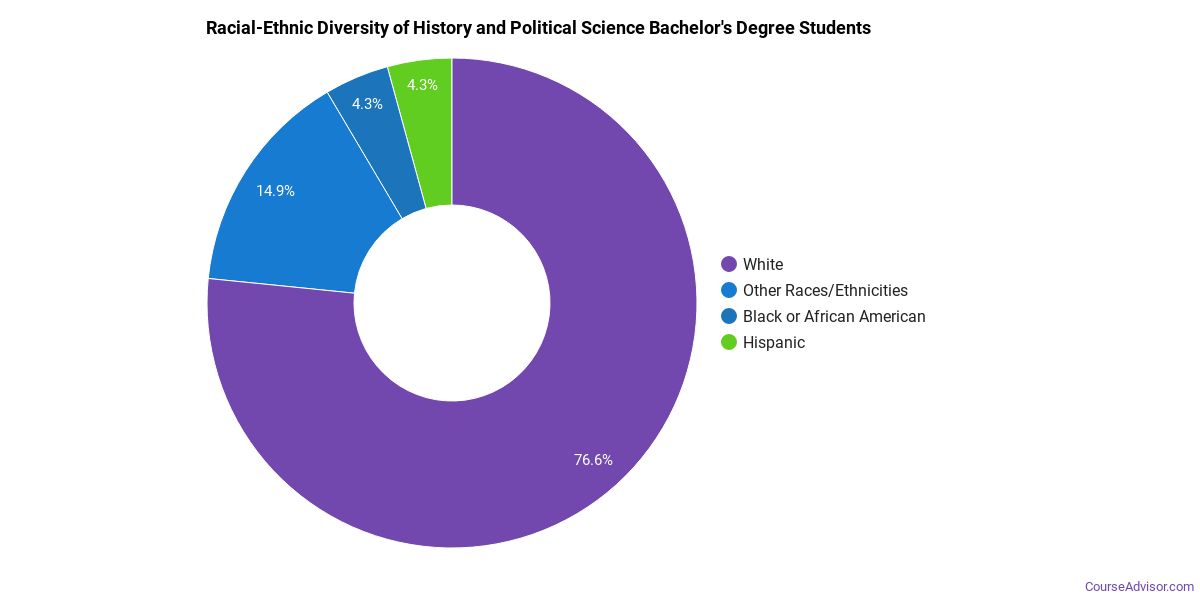
The racial-ethnic distribution of history and political science bachelor’s degree students is as follows:
| Race/Ethnicity | Number of Grads |
|---|---|
| Asian | 0 |
| Black or African American | 2 |
| Hispanic or Latino | 2 |
| White | 36 |
| International Students | 0 |
| Other Races/Ethnicities | 7 |
Most Popular History and Political Science Programs for Bachelor’s Degrees
There are 9 colleges that offer a bachelor’s degree in history and political science. Learn more about the most popular 9 below:

Indiana University - Kokomo tops the list of the most popular school in the U.S. for history and political science majors who are seeking their bachelor's degree. Roughly 3,200 attend the school each year. The average in-state tuition for full-time undergraduates is $7,170 per year, while in-state graduate students, on average, pay $7,613 per year. During the 2020-2021 academic year, 15 people received their bachelor's degree in history and political science from IU Kokomo. About 40% of this group were women, and 33% were students from an underrepresented racial-ethnic group.

Abraham Baldwin Agricultural College comes in at #2 on our list of the most popular colleges offering bachelor's degrees in history and political science. Roughly 3,900 attend the school each year. During the 2020-2021 academic year, 8 people received their bachelor's degree in history and political science from ABAC Tifton. Around 13% of these students were from an underrepresented racial-ethnic group, and 38% were women.

Eureka College is the 3rd most popular school in the nation for students seeking a bachelor's degree in history and political science. Roughly 500 attend the school each year. During the 2020-2021 academic year, 7 people received their bachelor's degree in history and political science from Eureka College. Of these students, 14% were women and 29% were members of underrepresented racial-ethnic groups.

The 4th most popular school in the country for history and political science majors who are seeking their bachelor's degree is Monmouth University. Each year, around 5,600 students seeking various degrees attend the university. The average in-state tuition for full-time undergraduates is $40,968 per year, while in-state graduate students, on average, pay $28,578 per year. For the 2020-2021 academic year, 6 bachelor's degrees were handed out to history and political science majors at Monmouth.

The 5th most popular school in the country for history and political science majors who are seeking their bachelor's degree is King University. Roughly 1,700 attend the school each year. The average in-state tuition for full-time undergraduates is $31,050 per year, while in-state graduate students, on average, pay $14,207 per year. The history and political science program at King University awarded 4 bachelor's degrees during the 2020-2021 school year.
Curry College comes in at #5 on our list of the most popular colleges offering bachelor's degrees in history and political science. The average in-state tuition for full-time undergraduates is $41,240 per year, while in-state graduate students, on average, pay $15,114 per year. For the 2020-2021 academic year, 4 bachelor's degrees were handed out to history and political science majors at Curry.

Averett University comes in at #7 on our list of the most popular colleges offering bachelor's degrees in history and political science. The average in-state tuition for full-time undergraduates is $36,900 per year, while in-state graduate students, on average, pay $11,790 per year. For the 2020-2021 academic year, 3 bachelor's degrees were handed out to history and political science majors at AU.
Explore Major by State
Alabama
Arkansas
Connecticut
Florida
Idaho
Iowa
Louisiana
Massachusetts
Mississippi
Nebraska
New Jersey
North Carolina
Oklahoma
Rhode Island
Tennessee
Vermont
West Virginia
Related Majors
Below are some popular majors that are similar to history and political science that offer bachelor’s degrees.
| Major | Annual Degrees Awarded |
|---|---|
| Other Interdisciplinary Studies | 24,095 |
| Interdisciplinary Studies | 7,810 |
| International Studies | 6,197 |
| Nutrition Science | 3,815 |
| Cognitive Science | 2,650 |
References
*The racial-ethnic minority student count is calculated by taking the total number of students and subtracting white students, international students, and students whose race/ethnicity was unknown. This number is then divided by the total number of students at the school to obtain the percentage of racial-ethnic minorities.
More about our data sources and methodologies.
Featured Schools
 Request Info
|
Southern New Hampshire University You have goals. Southern New Hampshire University can help you get there. Whether you need a bachelor's degree to get into a career or want a master's degree to move up in your current career, SNHU has an online program for you. Find your degree from over 200 online programs. Learn More > |
Course Advisor provides higher-education, college and university, degree, program, career, salary, and other helpful information to students, faculty, institutions, and other internet audiences. Presented information and data are subject to change. Inclusion on this website does not imply or represent a direct relationship with the company, school, or brand. Information, though believed correct at time of publication, may not be correct, and no warranty is provided. Contact the schools to verify any information before relying on it. Financial aid may be available for those who qualify. The displayed options may include sponsored or recommended results, not necessarily based on your preferences.
© Course Advisor – All Rights Reserved.