Undergraduate Certificates in Liberal Arts / Sciences & Humanities
Featured schools near , edit
Education Levels of Liberal Arts / Sciences & Humanities Majors
During the 2020-2021 academic year, 93,686 students earned their undergraduate certificate in liberal arts / sciences and humanities. The following table shows the number of diplomas awarded in liberal arts / sciences and humanities at each degree level.
| Education Level | Number of Grads |
|---|---|
| Associate Degree | 401,197 |
| Undergraduate Certificate | 93,686 |
| Bachelor’s Degree | 43,302 |
| Basic Certificate | 15,948 |
| Master’s Degree | 2,044 |
| Graduate Certificate | 546 |
| Doctor’s Degree | 90 |
Earnings of Liberal Arts / Sciences & Humanities Majors With Undergraduate Certificates
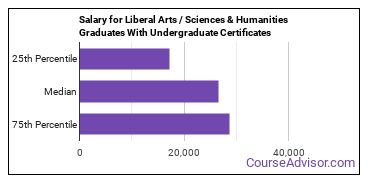
The median salary for graduates holding an undergraduate certificate in liberal arts / sciences and humanities is $26,564. A lot of factors can contribute to this number, such as the location of your workplace and the availability of other perks and bonuses. A better approximation of salary is to look at the typical range of salaries. In this case the low is $17,301 and the high is $28,648.

Student Debt
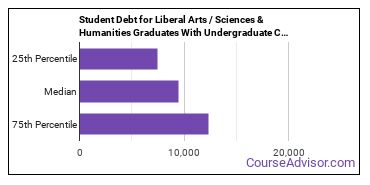
The median student debt for graduates holding an undergraduate certificate in liberal arts / sciences and humanities is $9,478. The school you go to and how long it takes you to graduate, among other things, can cause this number to vary. The chart below shows the range of accumulated debt loads. On the high side of the range, $12,305 is the debt load, and the debt load on the low side is $7,438.

Those students who are paying back their debt on a 10-year repayment plan have a median monthly payment of $249.
Student Diversity
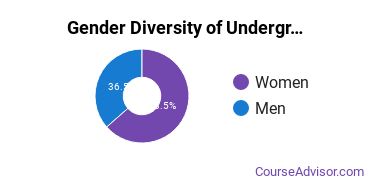
More women than men pursue their undergraduate certificate in liberal arts / sciences and humanities. About 63.5% of graduates with this degree are female.
| Gender | Number of Grads |
|---|---|
| Men | 34,169 |
| Women | 59,517 |

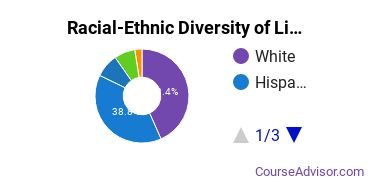
The racial-ethnic distribution of liberal arts / sciences and humanities undergraduate certificate students is as follows:
| Race/Ethnicity | Number of Grads |
|---|---|
| Asian | 8,256 |
| Black or African American | 6,169 |
| Hispanic or Latino | 33,164 |
| White | 37,042 |
| International Students | 2,124 |
| Other Races/Ethnicities | 6,931 |

Liberal Arts / Sciences & Humanities Majors to Study
| Major | Annual Degrees Awarded |
|---|---|
| Liberal Arts General Studies | 93,686 |
Explore Major by State
Alabama
Arkansas
Connecticut
Florida
Idaho
Iowa
Louisiana
Massachusetts
Mississippi
Nebraska
New Jersey
North Carolina
Oklahoma
Rhode Island
Tennessee
Vermont
West Virginia
Related Majors
Below are some popular majors that are similar to liberal arts / sciences and humanities that offer undergraduate certificates.
| Major | Annual Degrees Awarded |
|---|---|
| Visual & Performing Arts | 8,664 |
| Foreign Languages & Linguistics | 684 |
| Theology & Religious Vocations | 583 |
| English Language & Literature | 477 |
| Philosophy & Religious Studies | 51 |
References
*The racial-ethnic minority student count is calculated by taking the total number of students and subtracting white students, international students, and students whose race/ethnicity was unknown. This number is then divided by the total number of students at the school to obtain the percentage of racial-ethnic minorities.
- College Factual
- National Center for Education Statistics
- O*NET Online
- Bureau of Labor Statistics
- Image Credit: By Jacques Sablet (Switzerland, Morges, 1749-1803) under License
More about our data sources and methodologies.
Featured Schools
 Request Info
|
Southern New Hampshire University You have goals. Southern New Hampshire University can help you get there. Whether you need a bachelor's degree to get into a career or want a master's degree to move up in your current career, SNHU has an online program for you. Find your degree from over 200 online programs. Learn More > |

