Basic Certificates in History
Featured schools near , edit
Education Levels of History Majors
During the 2020-2021 academic year, 121 students earned their basic certificate in history. The following table shows the number of diplomas awarded in history at each degree level.
| Education Level | Number of Grads |
|---|---|
| Bachelor’s Degree | 25,656 |
| Master’s Degree | 3,509 |
| Associate Degree | 2,558 |
| Doctor’s Degree | 721 |
| Graduate Certificate | 161 |
| Basic Certificate | 121 |
| Undergraduate Certificate | 5 |
Earnings of History Majors With Basic Certificates
We are unable to calculate the median earnings for history majors with their basic certificate due to lack of data.
Student Debt
The data on debt ranges for history majors who have their basic certificate is not available.
Student Diversity
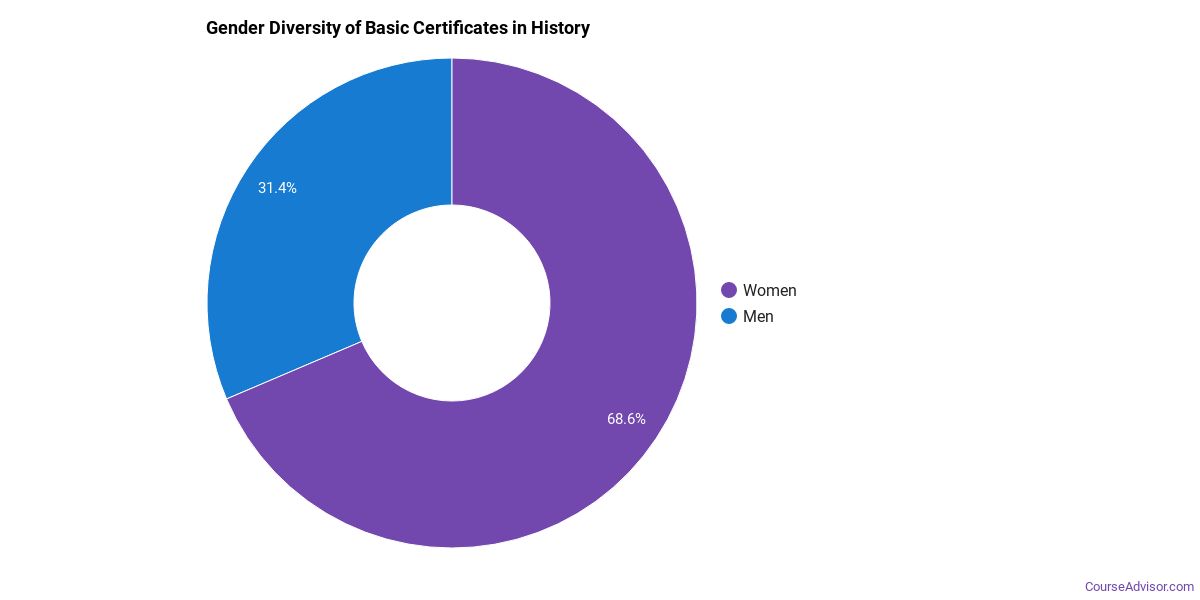
More women than men pursue their basic certificate in history. About 68.6% of graduates with this degree are female.
| Gender | Number of Grads |
|---|---|
| Men | 38 |
| Women | 83 |
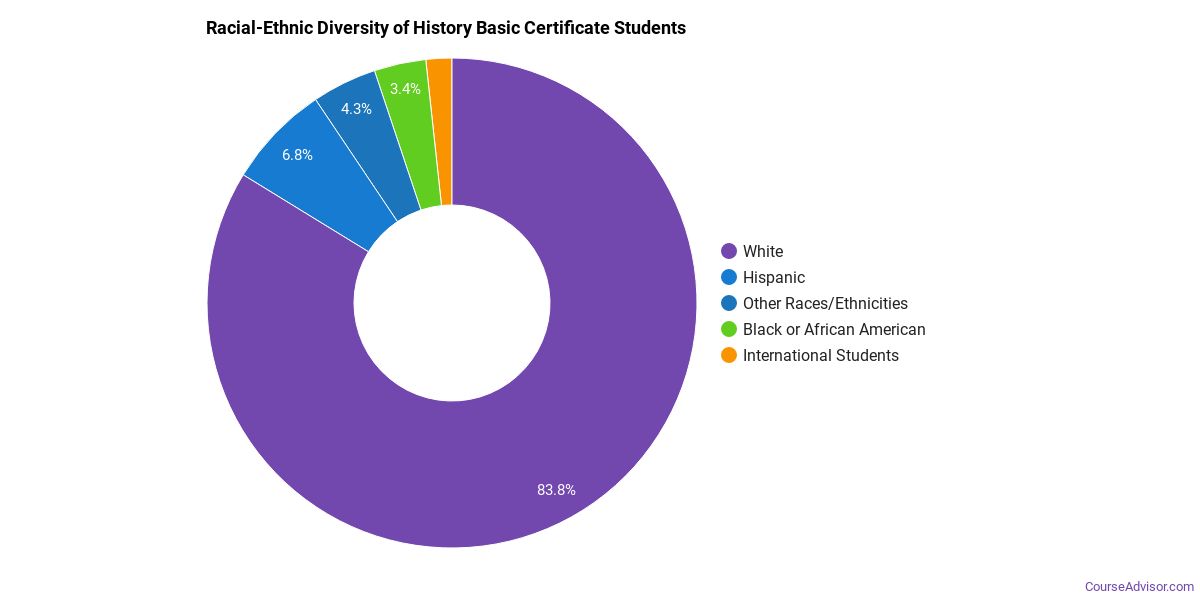
The racial-ethnic distribution of history basic certificate students is as follows:
| Race/Ethnicity | Number of Grads |
|---|---|
| Asian | 4 |
| Black or African American | 4 |
| Hispanic or Latino | 8 |
| White | 98 |
| International Students | 2 |
| Other Races/Ethnicities | 5 |
Explore Major by State
Alabama
Arkansas
Connecticut
Florida
Idaho
Iowa
Louisiana
Massachusetts
Mississippi
Nebraska
New Jersey
North Carolina
Oklahoma
Rhode Island
Tennessee
Vermont
West Virginia
References
*The racial-ethnic minority student count is calculated by taking the total number of students and subtracting white students, international students, and students whose race/ethnicity was unknown. This number is then divided by the total number of students at the school to obtain the percentage of racial-ethnic minorities.
More about our data sources and methodologies.
Featured Schools
 Request Info
|
Southern New Hampshire University You have goals. Southern New Hampshire University can help you get there. Whether you need a bachelor's degree to get into a career or want a master's degree to move up in your current career, SNHU has an online program for you. Find your degree from over 200 online programs. Learn More > |
Course Advisor provides higher-education, college and university, degree, program, career, salary, and other helpful information to students, faculty, institutions, and other internet audiences. Presented information and data are subject to change. Inclusion on this website does not imply or represent a direct relationship with the company, school, or brand. Information, though believed correct at time of publication, may not be correct, and no warranty is provided. Contact the schools to verify any information before relying on it. Financial aid may be available for those who qualify. The displayed options may include sponsored or recommended results, not necessarily based on your preferences.
© Course Advisor – All Rights Reserved.