Undergraduate Certificates in Health Professions
Education Levels of Health Professions Majors
During the most recent year for which data is available, 137,838 people earned their undergraduate certificate in health professions. The following table shows the number of diplomas awarded in health professions at each degree level.
| Education Level | Number of Grads |
|---|---|
| Bachelor’s Degree | 256,172 |
| Associate Degree | 179,344 |
| Master’s Degree | 149,998 |
| Undergraduate Certificate | 137,838 |
| Basic Certificate | 135,330 |
| Doctor’s Degree | 89,473 |
| Graduate Certificate | 16,117 |
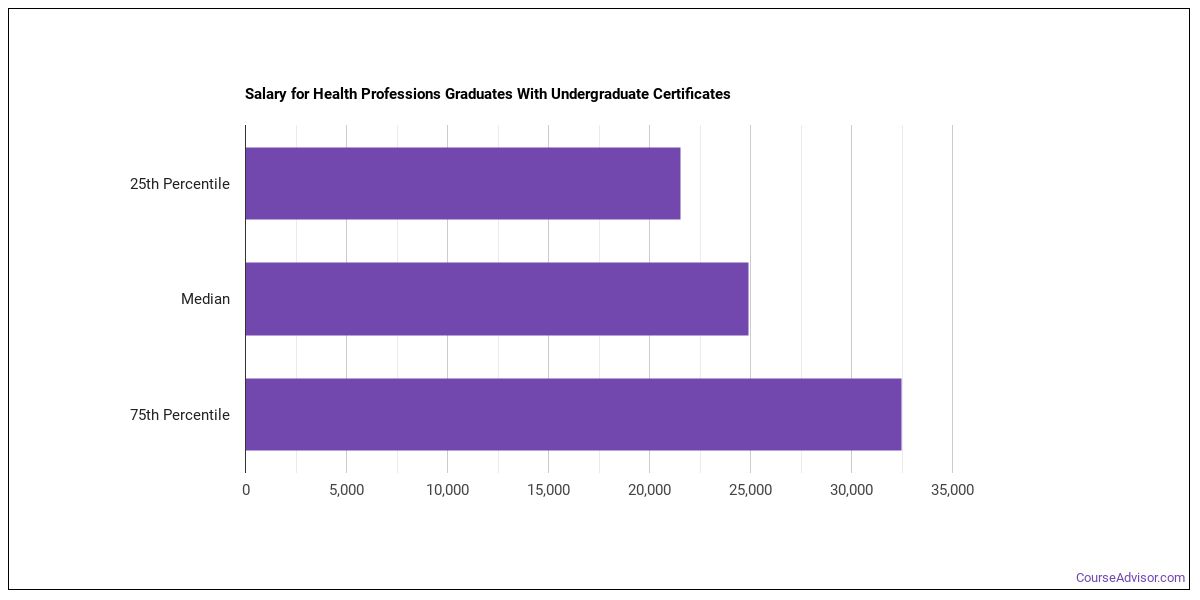
Earnings of Health Professions Majors With Undergraduate Certificates
The median salary for graduates holding an undergraduate certificate in health professions is $28,047. A lot of factors can contribute to this number, such as the location of your workplace and the availability of other perks and bonuses. A better approximation of salary is to look at the typical range of salaries. In this case the low is $24,818 and the high is $31,480.
Student Debt
The median student debt for graduates holding an undergraduate certificate in health professions is $5,840. The length of time it takes you to graduate and what college you attend can affect this number quite a bit. The chart below shows the range of accumulated debt loads. On the high side of the range, $7,868 is the debt load, and the debt load on the low side is $5,392.
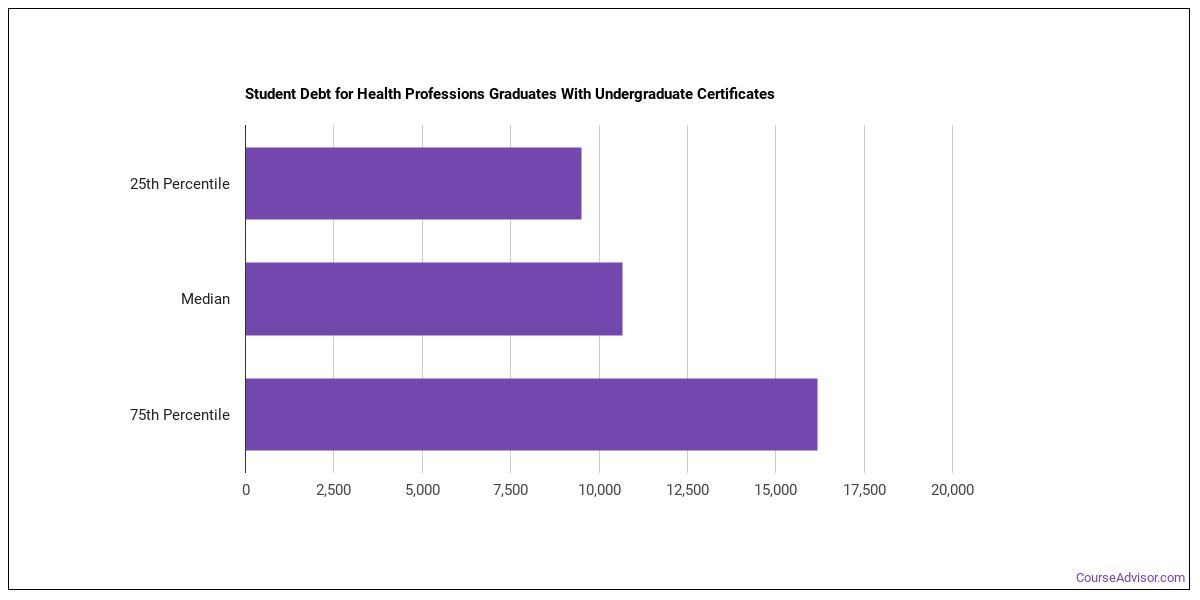
Those students who are paying back their debt on a 10-year repayment plan have a median monthly payment of $69.
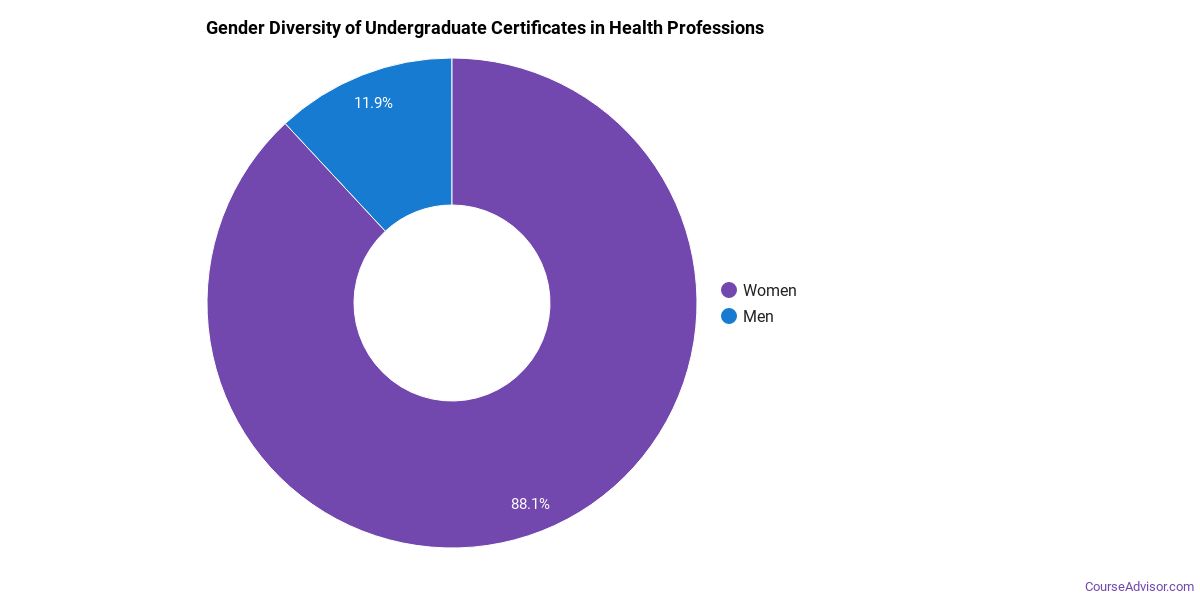
Student Diversity
More women than men pursue their undergraduate certificate in health professions. About 87.4% of graduates with this degree are female.
| Gender | Number of Grads |
|---|---|
| Men | 17,399 |
| Women | 120,439 |
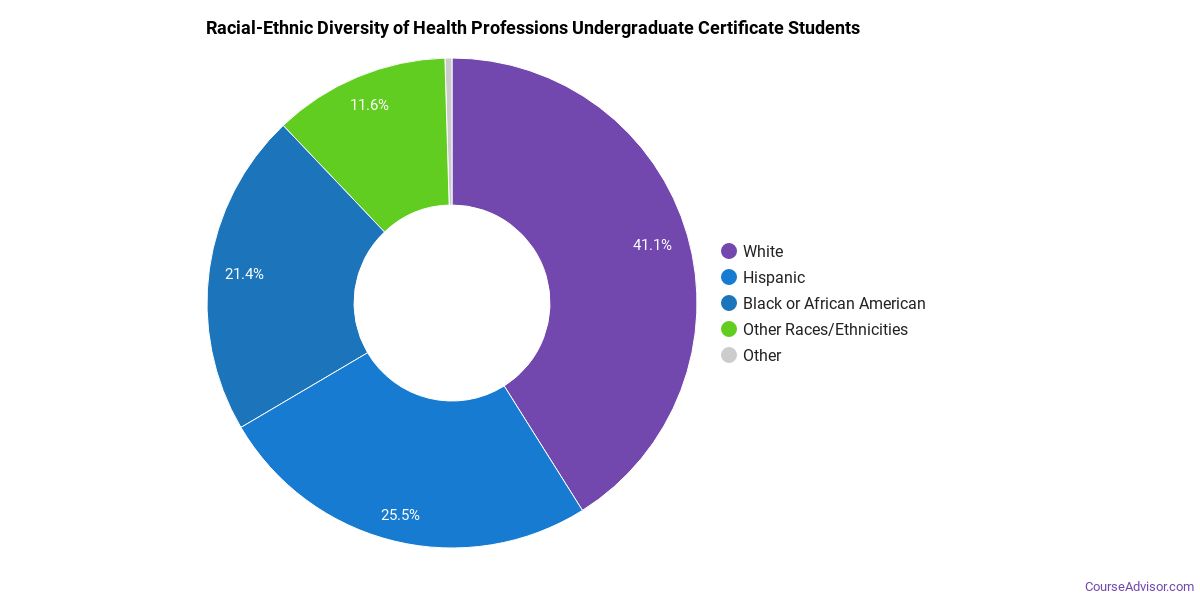
The racial-ethnic distribution of health professions undergraduate certificate students is as follows:
| Race/Ethnicity | Number of Grads |
|---|---|
| Asian | 5,624 |
| Black or African American | 29,433 |
| Hispanic or Latino | 34,945 |
| White | 48,437 |
| International Students | 652 |
| Other Races/Ethnicities | 18,747 |
Explore Major by State
Alabama
Arkansas
Connecticut
Florida
Idaho
Iowa
Louisiana
Massachusetts
Mississippi
Nebraska
New Jersey
North Carolina
Oklahoma
Rhode Island
Tennessee
Vermont
West Virginia
Related Majors
Below are some popular majors that are similar to health professions that offer undergraduate certificates.
| Major | Annual Degrees Awarded |
|---|
References
*The racial-ethnic minority student count is calculated by taking the total number of students and subtracting white students, international students, and students whose race/ethnicity was unknown. This number is then divided by the total number of students at the school to obtain the percentage of racial-ethnic minorities.
More about our data sources and methodologies.
Course Advisor provides higher-education, college and university, degree, program, career, salary, and other helpful information to students, faculty, institutions, and other internet audiences. Presented information and data are subject to change. Inclusion on this website does not imply or represent a direct relationship with the company, school, or brand. Information, though believed correct at time of publication, may not be correct, and no warranty is provided. Contact the schools to verify any information before relying on it. Financial aid may be available for those who qualify. The displayed options may include sponsored or recommended results, not necessarily based on your preferences.
© Course Advisor – All Rights Reserved.