Biologically Based Therapies Schools in Maryland
71 Biologically Based Therapies students earned their degrees in the state in 2022-2023.
In this state, Biologically Based Therapies is the 153rd most popular major out of a total 281 majors commonly available.
Education Levels of Biologically Based Therapies Majors in Maryland
Biologically Based Therapies majors in the state tend to have the following degree levels:
| Education Level | Number of Grads |
|---|---|
| Post-Master’s Certificate | 50 |
| Postbaccalaureate Certificate | 50 |
| Master’s Degree | 21 |
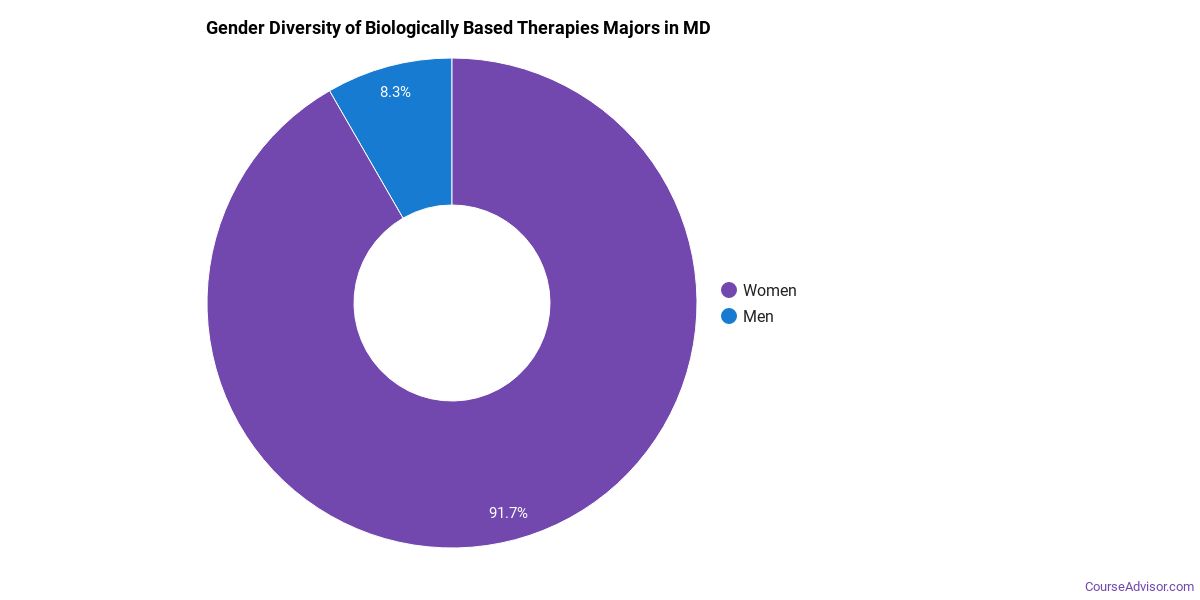
Gender Distribution
In Maryland, a biologically based therapies major is more popular with women than with men.
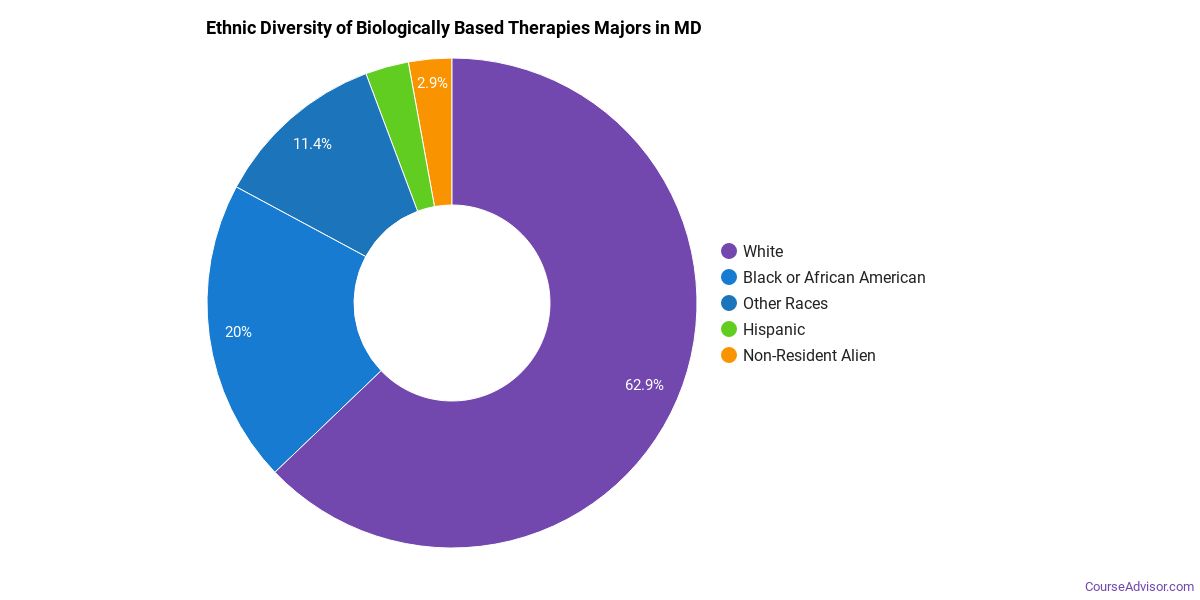
Racial Distribution
The racial distribution of biologically based therapies majors in Maryland is as follows:
- Asian: 1.4%
- Black or African American: 12.7%
- Hispanic or Latino: 1.4%
- White: 23.9%
- Non-Resident Alien: 52.1%
- Other Races: 8.5%
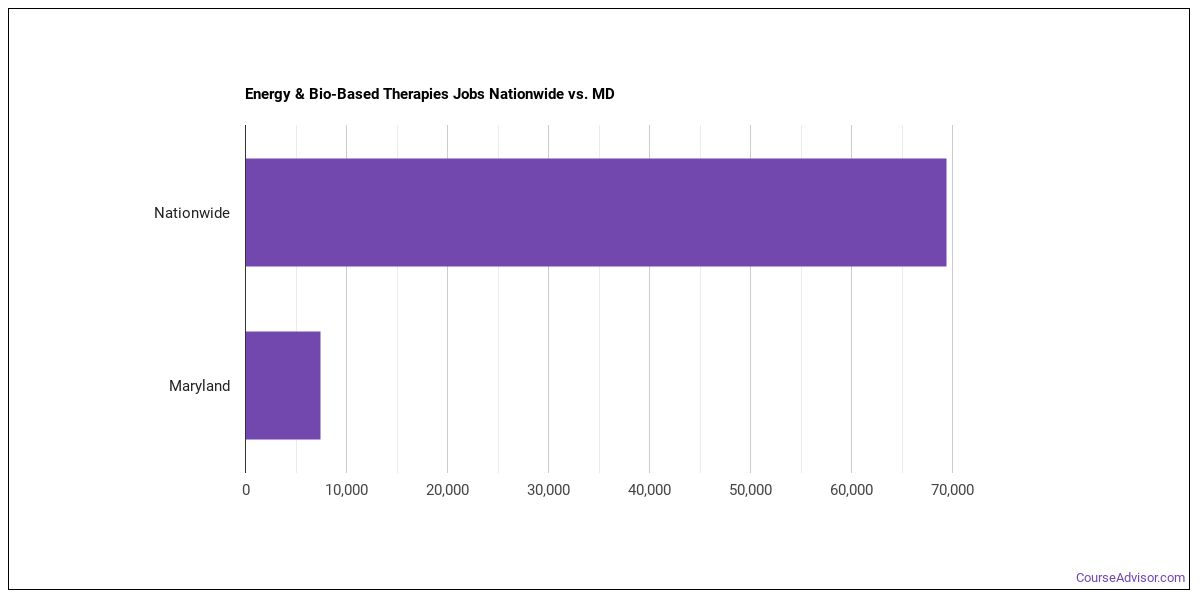
Jobs for Biologically Based Therapies Grads in Maryland
7,380 people in the state and 69,360 in the nation are employed in jobs related to biologically based therapies.
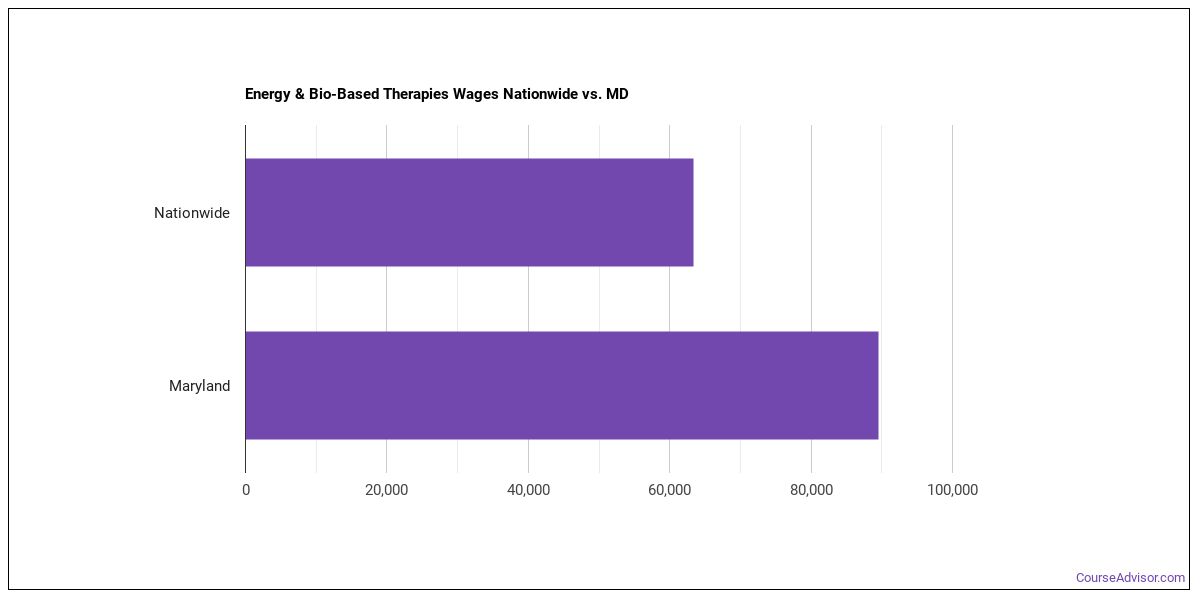
Wages for Biologically Based Therapies Jobs in Maryland
Biologically Based Therapies grads earn an average of $89,580 in the state and $63,340 nationwide.
Most Popular Biologically Based Therapies Programs in MD
There is one school in the state that offers this degree.

36% of the teachers are full time.
Request InformationBiologically Based Therapies Careers in MD
Some of the careers biologically based therapies majors go into include:
| Job Title | MD Job Growth | MD Median Salary |
|---|---|---|
| Healthcare Practitioners and Technical Workers | 10% | $93,040 |
| Health Diagnosing and Treating Practitioners | 3% | $136,660 |
Related Majors in Maryland
Below are some popular majors in the state that are similar to biologically based therapies.
| Major | Annual Graduates in MD |
|---|---|
| Nursing | 4,104 |
| Public Health | 1,786 |
| Health/Medical Admin Services | 1,108 |
| Allied Health Professions | 562 |
| Mental & Social Health Services | 461 |
| Pharmacy/Pharmaceutical Sciences | 440 |
| Rehabilitation Professions | 353 |
| Communication Sciences | 296 |
View all majors related to Biologically Based Therapies
Explore Major by State
Alabama
Arkansas
Connecticut
Florida
Idaho
Iowa
Louisiana
Massachusetts
Mississippi
Nebraska
New Jersey
North Carolina
Oklahoma
Rhode Island
Tennessee
Vermont
West Virginia
View Nationwide Biologically Based Therapies Report
References
More about our data sources and methodologies.
Course Advisor provides higher-education, college and university, degree, program, career, salary, and other helpful information to students, faculty, institutions, and other internet audiences. Presented information and data are subject to change. Inclusion on this website does not imply or represent a direct relationship with the company, school, or brand. Information, though believed correct at time of publication, may not be correct, and no warranty is provided. Contact the schools to verify any information before relying on it. Financial aid may be available for those who qualify. The displayed options may include sponsored or recommended results, not necessarily based on your preferences.
© Course Advisor – All Rights Reserved.