Ethnic Studies Schools in Maryland
84 students earned Ethnic Studies degrees in Maryland in the 2022-2023 year.
In this state, Ethnic Studies is the 112th most popular major out of a total 281 majors commonly available.
Featured Ethnic Studies Programs
Learn about start dates, transferring credits, availability of financial aid, and more by contacting the universities below.
Explore societal similarities and differences as seen through cultural, biological, archaeological and linguistic lenses when you earn one of your degrees in anthropology from Southern New Hampshire University.
Education Levels of Ethnic Studies Majors in Maryland
Ethnic Studies majors in the state tend to have the following degree levels:
| Education Level | Number of Grads |
|---|---|
| Bachelor’s Degree | 43 |
| Award Taking 1 to 2 Years | 18 |
| Award Taking 2 to 4 Years | 18 |
| Award Taking Less Than 1 Year | 8 |
| Associate Degree | 7 |
| Post-Master’s Certificate | 4 |
| Postbaccalaureate Certificate | 4 |
| Master’s Degree | 3 |
| Doctor’s Degree (Research / Scholarship) | 1 |
| Doctor’s Degree (Professional Practice) | 1 |
| Doctor’s Degree (Other) | 1 |
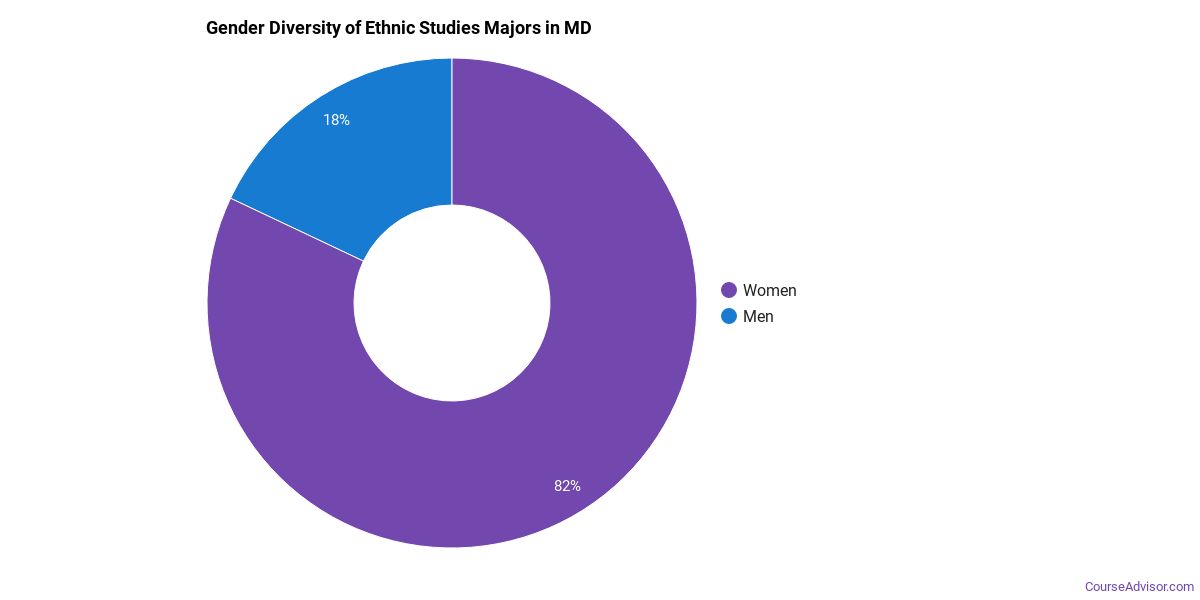
Gender Distribution
In Maryland, a ethnic studies major is more popular with women than with men.
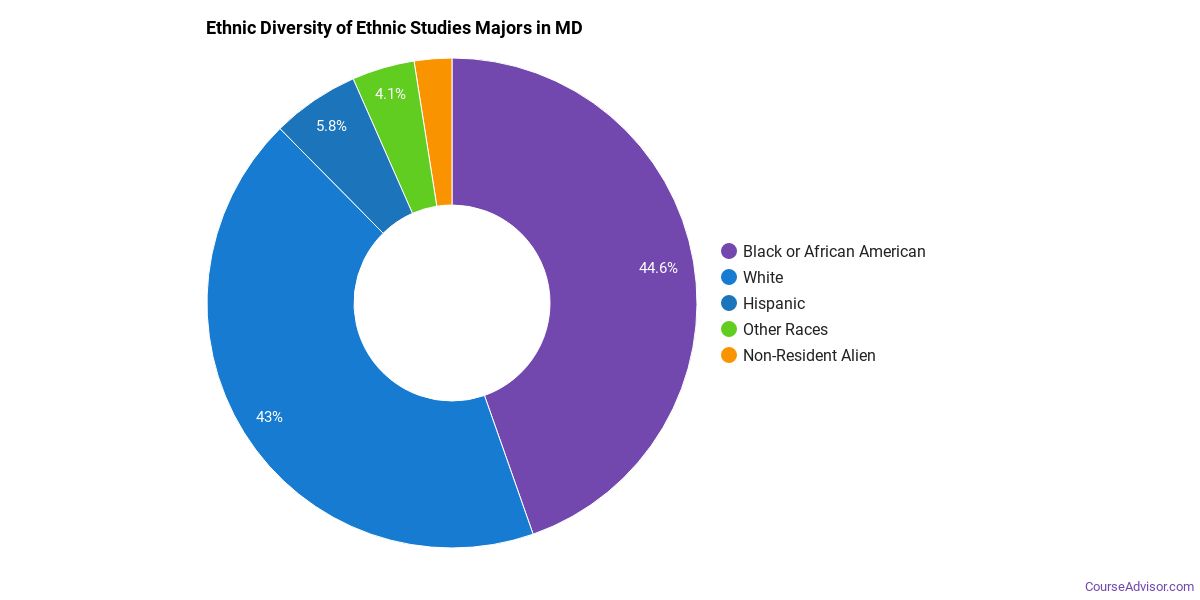
Racial Distribution
The racial distribution of ethnic studies majors in Maryland is as follows:
- Asian: 4.8%
- Black or African American: 33.3%
- Hispanic or Latino: 3.6%
- White: 54.8%
- Non-Resident Alien: 2.4%
- Other Races: 1.2%
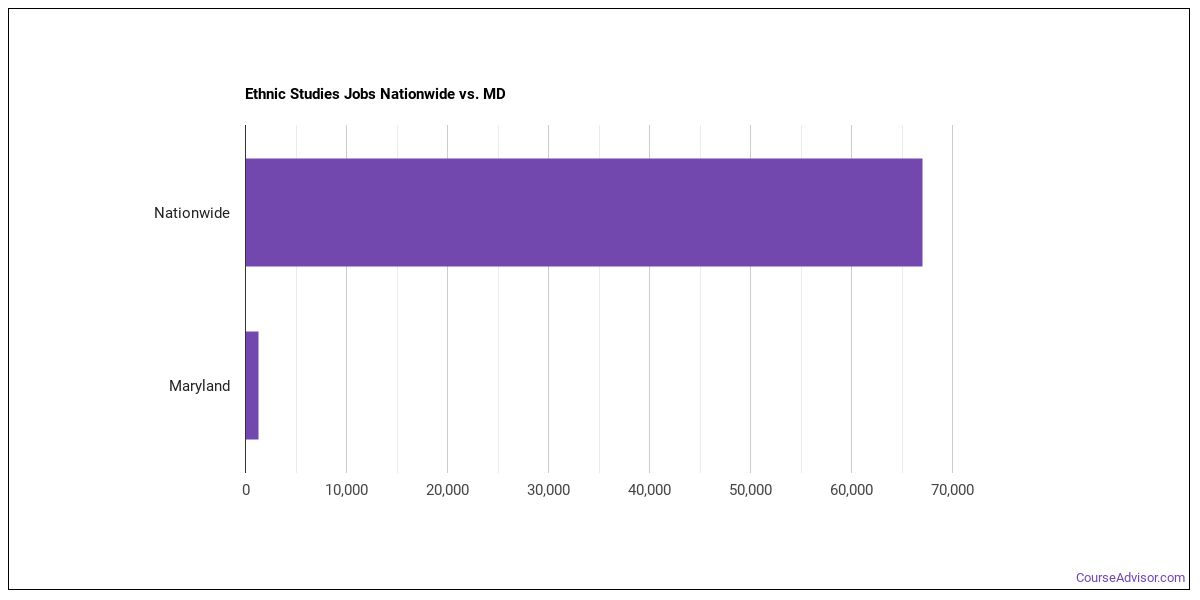
Jobs for Ethnic Studies Grads in Maryland
There are 1,280 people in the state and 66,990 people in the nation working in ethnic studies jobs.
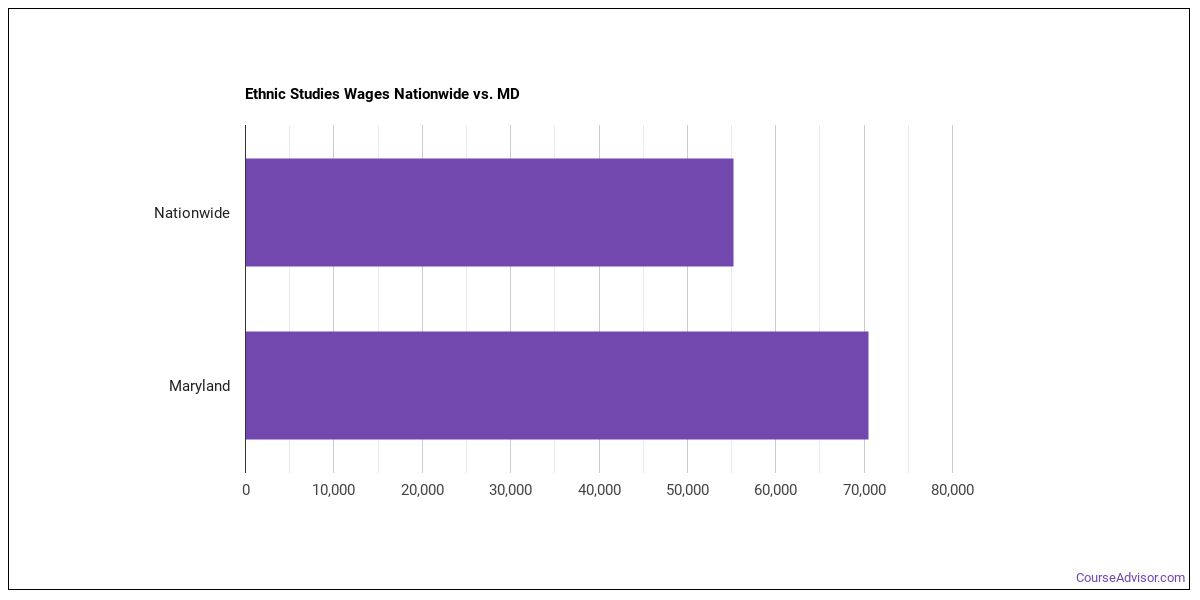
Wages for Ethnic Studies Jobs in Maryland
In this state, ethnic studies grads earn an average of $70,530. Nationwide, they make an average of $55,230.
Most Popular Ethnic Studies Programs in MD
There are 7 colleges in Maryland that offer ethnic studies degrees. Learn about the most popular 7 below:

The average student takes 4.22 years to complete their degree at UMCP. This public school has an average net price of $16,590. Students enjoy a student to faculty ratio of 18 to 1.
Request Information
The student to faculty ratio is 15 to 1. It takes the average student 4.38 years to graduate. This public school has an average net price of $14,151.
Request Information
32% of the teachers are full time. Of all the students who attend this school, 77% get financial aid. This public school has an average net price of $6,793.
Request Information
Most students complete their degree in 4.49 years. 64% of the teachers are full time. This public college charges it's students an average net price of $19,319.
Request Information
7 to 1 is the student to faculty ratio. The average student takes 4.18 years to complete their degree at Goucher. This private school has an average net price of $27,204.
Request Information
Seeking financial aid? At this school, 67% of students receive it. The average student takes 4.08 years to complete their degree at Johns Hopkins. Students enjoy a student to faculty ratio of 6 to 1.
Request Information
67% of the teachers are full time. The student to faculty ratio is 17 to 1. The average student takes 4.73 years to complete their degree at Morgan State.
Request InformationEthnic Studies Careers in MD
Some of the careers ethnic studies majors go into include:
| Job Title | MD Job Growth | MD Median Salary |
|---|---|---|
| Area, Ethnic, and Cultural Studies Professors | 9% | $75,370 |
| Interpreters and Translators | 7% | $71,280 |
Related Majors in Maryland
Below are some popular majors in the state that are similar to ethnic studies.
| Major | Annual Graduates in MD |
|---|---|
| Area Studies | 141 |
View all majors related to Ethnic Studies
Explore Major by State
Alabama
Arkansas
Connecticut
Florida
Idaho
Iowa
Louisiana
Massachusetts
Mississippi
Nebraska
New Jersey
North Carolina
Oklahoma
Rhode Island
Tennessee
Vermont
West Virginia
View Nationwide Ethnic Studies Report
References
- College Factual
- National Center for Education Statistics
- O*NET Online
- Image Credit: By G. MГјtzel under License
More about our data sources and methodologies.
Course Advisor provides higher-education, college and university, degree, program, career, salary, and other helpful information to students, faculty, institutions, and other internet audiences. Presented information and data are subject to change. Inclusion on this website does not imply or represent a direct relationship with the company, school, or brand. Information, though believed correct at time of publication, may not be correct, and no warranty is provided. Contact the schools to verify any information before relying on it. Financial aid may be available for those who qualify. The displayed options may include sponsored or recommended results, not necessarily based on your preferences.
© Course Advisor – All Rights Reserved.