Engineering Schools in Tennessee
2,297 Engineering students earned their degrees in the state in 2022-2023.
As a degree choice, Engineering is the 9th most popular major in the state.
Education Levels of Engineering Majors in Tennessee
Engineering majors in the state tend to have the following degree levels:
| Education Level | Number of Grads |
|---|---|
| Bachelor’s Degree | 1,652 |
| Master’s Degree | 397 |
| Doctor’s Degree (Research / Scholarship) | 219 |
| Doctor’s Degree (Professional Practice) | 219 |
| Doctor’s Degree (Other) | 219 |
| Associate Degree | 24 |
| Post-Master’s Certificate | 5 |
| Postbaccalaureate Certificate | 5 |
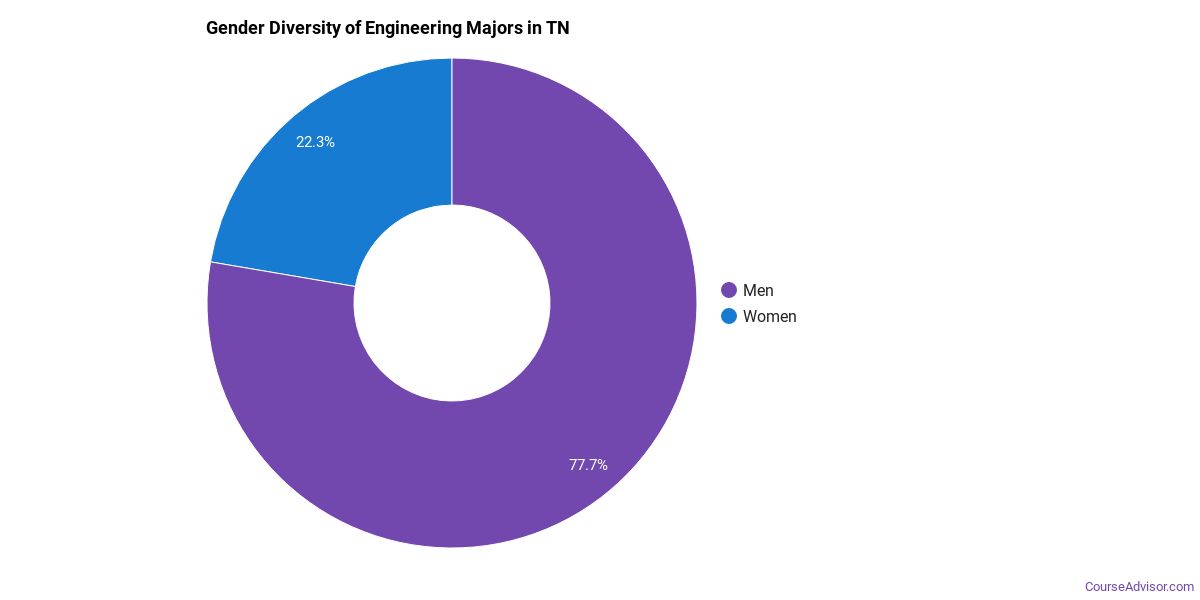
Gender Distribution
In Tennessee, a engineering major is more popular with men than with women.
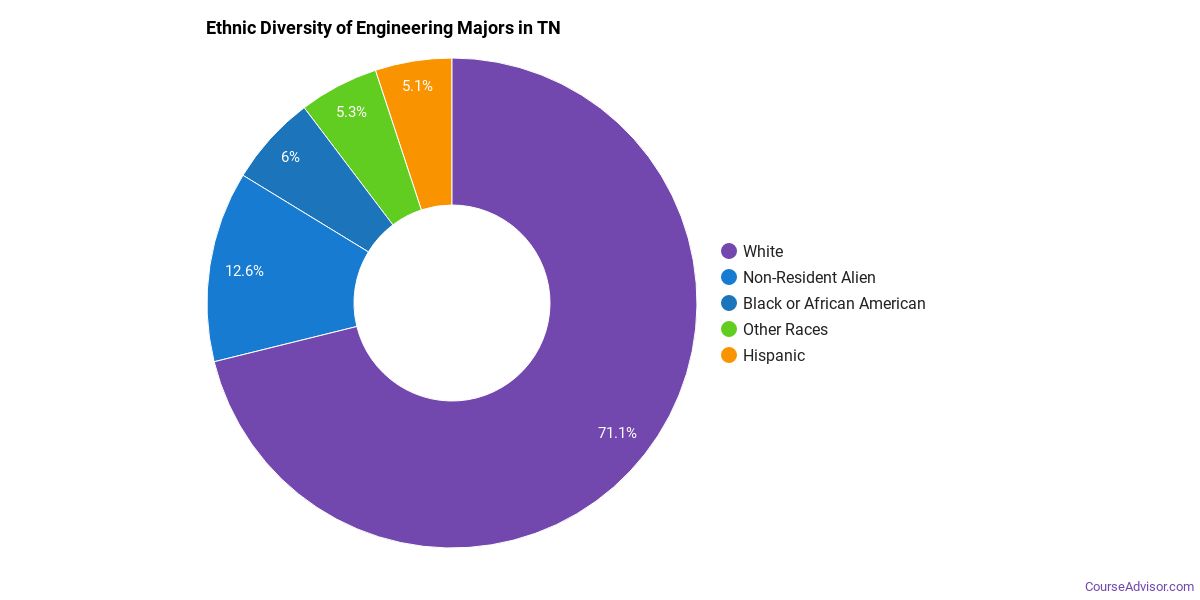
Racial Distribution
The racial distribution of engineering majors in Tennessee is as follows:
- Asian: 5.7%
- Black or African American: 6.5%
- Hispanic or Latino: 5.4%
- White: 66.4%
- Non-Resident Alien: 10.5%
- Other Races: 5.4%
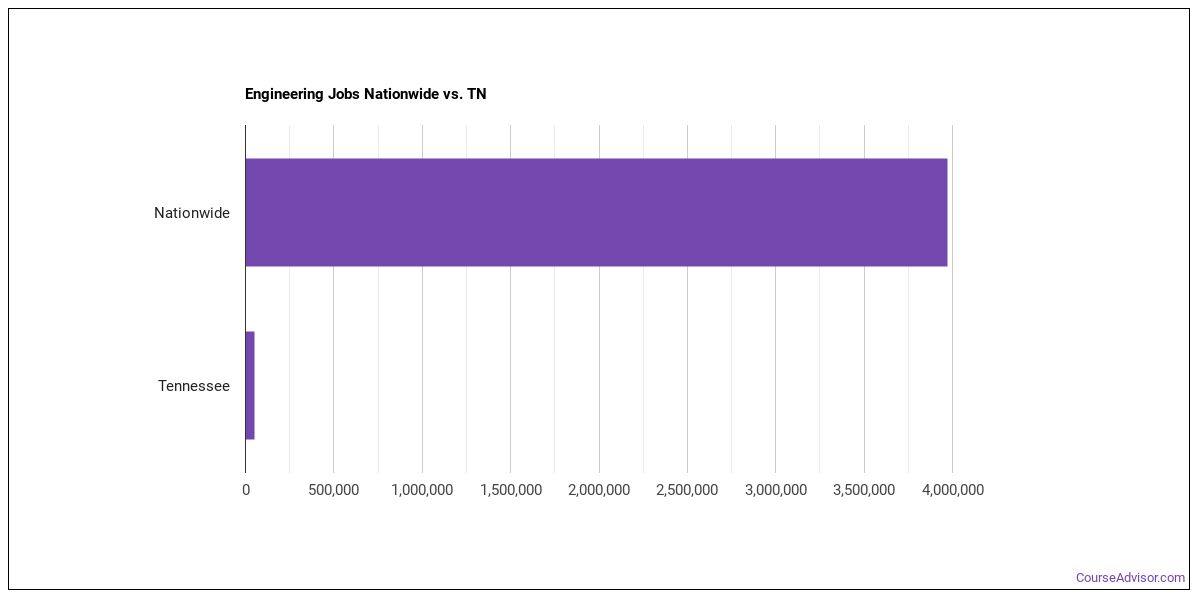
Jobs for Engineering Grads in Tennessee
There are 52,740 people in the state and 3,969,720 people in the nation working in engineering jobs.
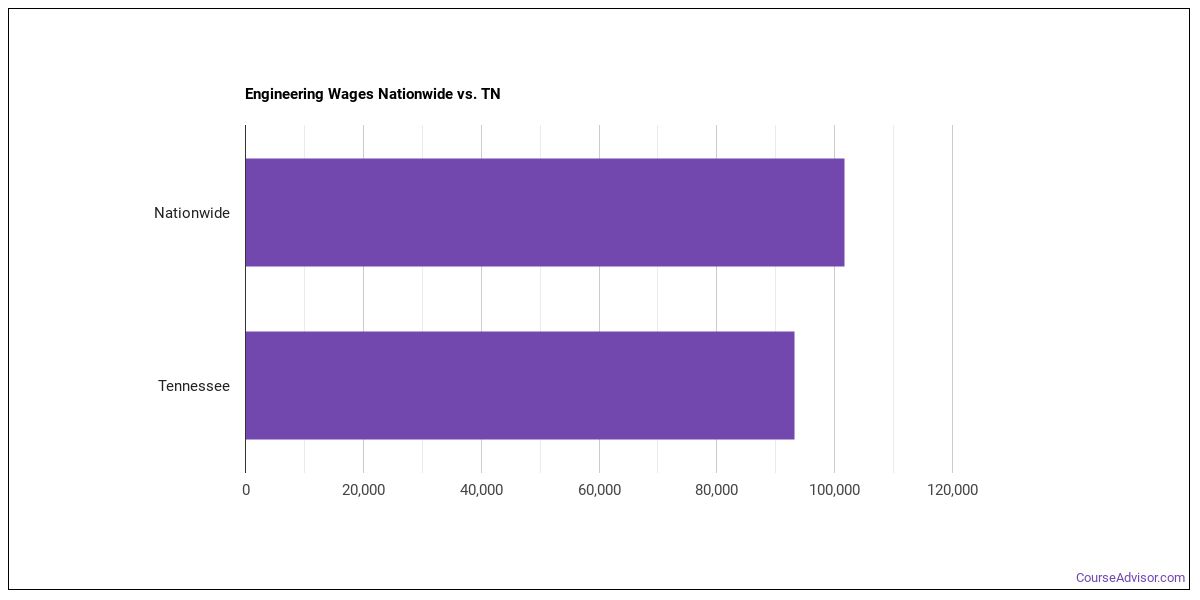
Wages for Engineering Jobs in Tennessee
Engineering grads earn an average of $93,180 in the state and $101,600 nationwide.
Most Popular Engineering Programs in TN
There are 10 colleges in Tennessee that offer engineering degrees. Learn about the most popular 10 below:

Most students complete their degree in 4.31 years. Students enjoy a student to faculty ratio of 18 to 1. 85% of the teachers are full time.
Request Information
The full-time teacher rate is 74%. Most students complete their degree in 4.50 years. Students enjoy a student to faculty ratio of 18 to 1.
Request Information
7 to 1 is the student to faculty ratio. 82% of the teachers are full time. This private school has an average net price of $20,917.
Request Information
68% of the teachers are full time. 96% of students get financical aid. A typical student attending UT Chattanooga will pay a net price of $13,539.
Request Information
Most students complete their degree in 4.57 years. 71% of the teachers are full time. 99% of students are awarded financial aid at this school.
Request Information
Of all the teachers who work at the school, 70% are considered full time. The student to faculty ratio is 14 to 1. 98% of students get financical aid.
Request Information
Of all the teachers who work at the school, 95% are considered full time. It takes the average student 4.47 years to graduate. 9 to 1 is the student to faculty ratio.
Request Information
A typical student attending Middle Tennessee State University will pay a net price of $13,267. 81% of the teachers are full time. It takes the average student 4.55 years to graduate.
Request Information
100% of students are awarded financial aid at this school. The average student takes 4.18 years to complete their degree at Lipscomb. An average student at Lipscomb will pay a net price of $26,070.
Request Information
The student to faculty ratio is 15 to 1. 69% of the teachers are full time. 99% of students are awarded financial aid at this school.
Request InformationEngineering Careers in TN
Some of the careers engineering majors go into include:
| Job Title | TN Job Growth | TN Median Salary |
|---|---|---|
| Architectural and Engineering Managers | 18% | $119,370 |
| Electrical Engineers | 14% | $90,930 |
| Nuclear Engineers | 13% | $120,570 |
| Biomedical Engineers | 10% | $62,890 |
| Materials Engineers | 7% | $113,380 |
Related Majors in Tennessee
Below are some popular majors in the state that are similar to engineering.
| Major | Annual Graduates in TN |
|---|---|
| Biological & Biomedical Sciences | 2,478 |
| Agriculture | 1,090 |
| Engineering Technologies | 951 |
| Physical Sciences | 721 |
| Mathematics & Statistics | 636 |
| Natural Resources & Conservation | 320 |
| Architecture/Urban Planning | 127 |
View all majors related to Engineering
Explore Major by State
Alabama
Arkansas
Connecticut
Florida
Idaho
Iowa
Louisiana
Massachusetts
Mississippi
Nebraska
New Jersey
North Carolina
Oklahoma
Rhode Island
Tennessee
Vermont
West Virginia
View Nationwide Engineering Report
References
- College Factual
- National Center for Education Statistics
- O*NET Online
- Image Credit: By Petty Officer 3rd Class Declan Barnes under License
More about our data sources and methodologies.
Course Advisor provides higher-education, college and university, degree, program, career, salary, and other helpful information to students, faculty, institutions, and other internet audiences. Presented information and data are subject to change. Inclusion on this website does not imply or represent a direct relationship with the company, school, or brand. Information, though believed correct at time of publication, may not be correct, and no warranty is provided. Contact the schools to verify any information before relying on it. Financial aid may be available for those who qualify. The displayed options may include sponsored or recommended results, not necessarily based on your preferences.
© Course Advisor – All Rights Reserved.