Engineering Schools in Illinois
Featured schools near , edit
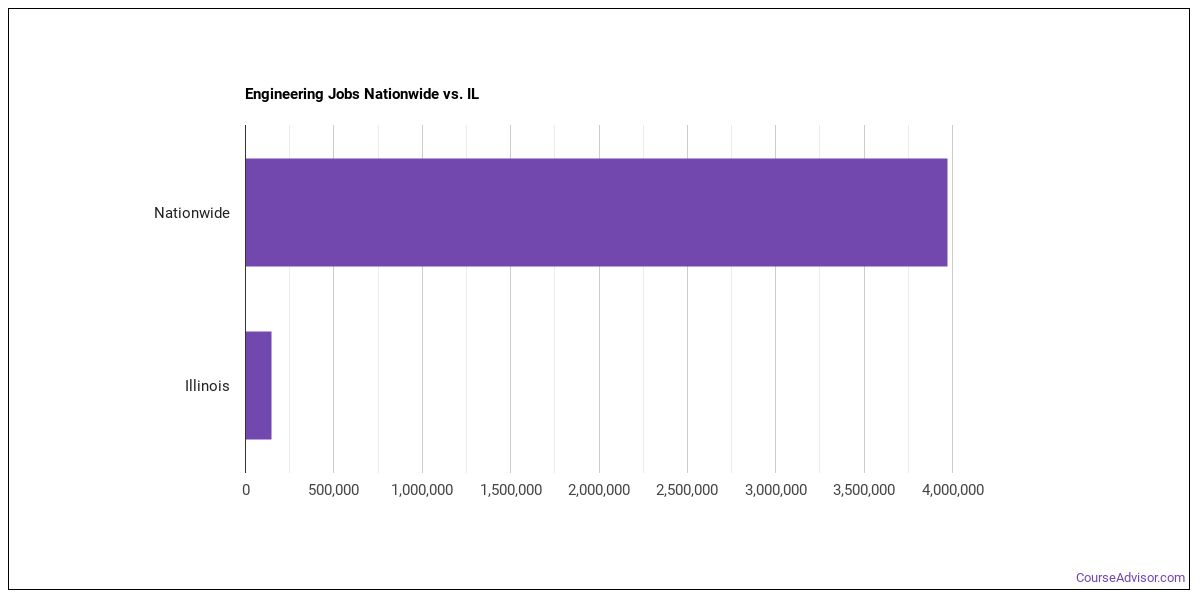
Jobs for Engineering Grads in Illinois
164,550 people in the state and 4,881,860 in the nation are employed in jobs related to Engineering.
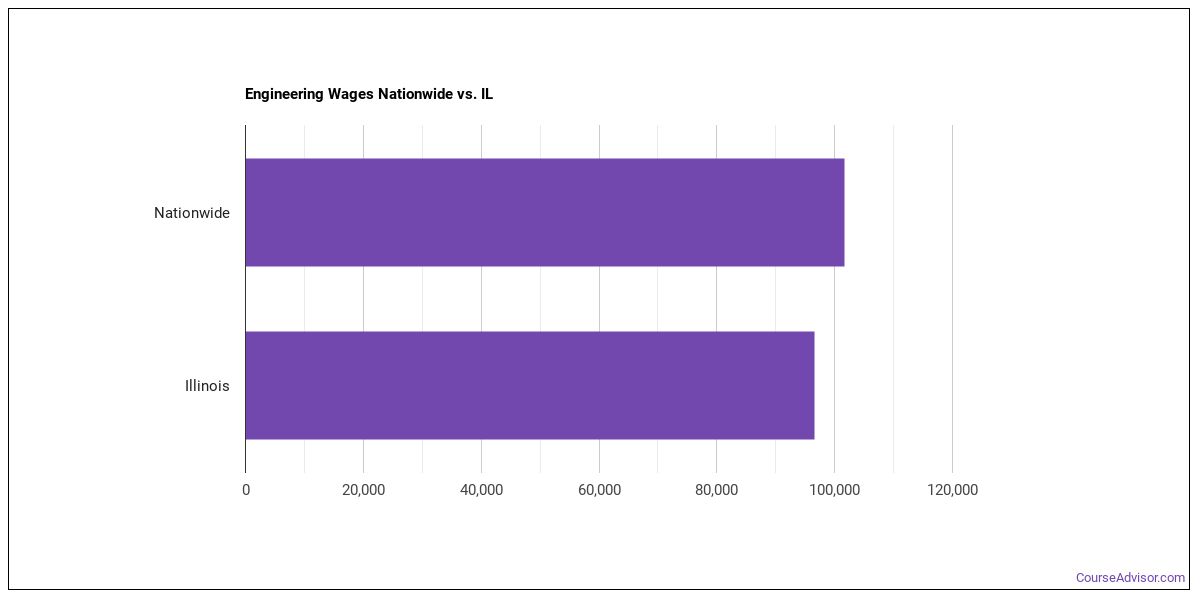
Wages for Engineering Jobs in Illinois
A typical salary for an Engineering grad in the state is $119,916, compared to a typical salary of $128,860 nationwide.
Most Popular Engineering Programs in IL
Our data covers 6 colleges in Illinois offering Engineering degrees. Learn about the most popular 6 below:

Graduates earn a median salary of $53,513 in their first year after graduation. About 44% of those who apply are admitted. 94% of full-time students return after their first year.
Graduates earn a median salary of $73,331 in their first year after graduation. With an admission rate of 7%, getting in takes some planning. 97% of full-time students return after their first year.
Grads earn a median early-career salary of $47,662 after earning their degree at this institution. The school admits about 78% of applicants. 78% of full-time students return after their first year.
Grads earn a median early-career salary of $64,069 after earning their degree at this institution. With an admission rate of 55%, getting in takes some planning. 87% of full-time students return after their first year.
Graduates earn a median salary of $48,249 in their first year after graduation. With an admission rate of 97%, getting in takes some planning. The full-time student retention rate is 72%.
One year after graduating, alumni of this school earn a median of $45,902 a year. With an admission rate of 70%, getting in takes some planning. 70% of full-time students return after their first year.
Engineering Careers in IL
Some of the careers Engineering majors go into include:
| Job Title | Nationwide Job Growth | Nationwide Median Salary |
|---|---|---|
| Engineering Teachers, Postsecondary | — | $79,889 |
| Biofuels/Biodiesel Technology and Product Development Managers | — | $89,263 |
| Architectural and Engineering Managers | — | $101,277 |
| Nanosystems Engineers | — | $50,152 |
| Wind Energy Engineers | — | $98,460 |
| Engineers, All Other | — | $136,628 |
| Solar Energy Systems Engineers | — | $116,775 |
| Energy Engineers, Except Wind and Solar | — | $59,756 |
| Robotics Engineers | — | $72,925 |
| Mechatronics Engineers | — | $115,569 |
| Transportation Engineers | — | $120,210 |
| Water/Wastewater Engineers | — | $86,573 |
Explore Major by State
Alabama
Arkansas
Connecticut
Florida
Hawaii
Indiana
Kentucky
Maryland
Minnesota
Montana
New Hampshire
New York
Ohio
Pennsylvania
South Carolina
Texas
Virgin Islands
West Virginia
View Nationwide Engineering Report
References
More about our data sources and methodologies.
Course Advisor provides higher-education, college and university, degree, program, career, salary, and other helpful information to students, faculty, institutions, and other internet audiences. Presented information and data are subject to change. Inclusion on this website does not imply or represent a direct relationship with the company, school, or brand. Information, though believed correct at time of publication, may not be correct, and no warranty is provided. Contact the schools to verify any information before relying on it. Financial aid may be available for those who qualify. The displayed options may include sponsored or recommended results, not necessarily based on your preferences.
© Course Advisor – All Rights Reserved.