Ceramic Engineering Schools in New Jersey
33 students earned Ceramic Engineering degrees in New Jersey in the 2022-2023 year.
In this state, Ceramic Engineering is the 141st most popular major out of a total 276 majors commonly available.
Education Levels of Ceramic Engineering Majors in New Jersey
Ceramic Engineering majors in the state tend to have the following degree levels:
| Education Level | Number of Grads |
|---|---|
| Master’s Degree | 14 |
| Bachelor’s Degree | 11 |
| Doctor’s Degree (Research / Scholarship) | 8 |
| Doctor’s Degree (Professional Practice) | 8 |
| Doctor’s Degree (Other) | 8 |
Gender Distribution
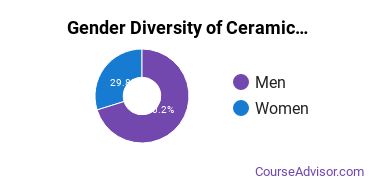
In New Jersey, a ceramic engineering major is more popular with women than with men.

Racial Distribution
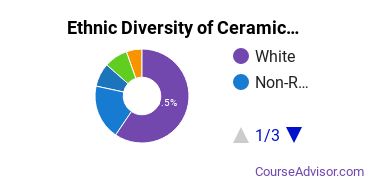
The racial distribution of ceramic engineering majors in New Jersey is as follows:
- Asian: 12.1%
- Black or African American: 6.1%
- Hispanic or Latino: 6.1%
- White: 36.4%
- Non-Resident Alien: 27.3%
- Other Races: 12.1%

Jobs for Ceramic Engineering Grads in New Jersey
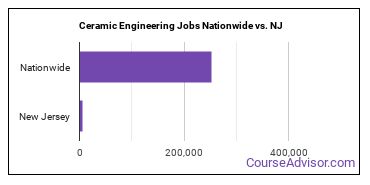
There are 5,790 people in the state and 252,750 people in the nation working in ceramic engineering jobs.

Wages for Ceramic Engineering Jobs in New Jersey
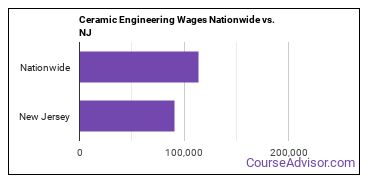
In this state, ceramic engineering grads earn an average of $90,740. Nationwide, they make an average of $113,680.

Most Popular Ceramic Engineering Programs in NJ
There is one school in the state that offers this degree.
Of all the teachers who work at the school, 58% are considered full time. Most students complete their degree in 4.26 years. Students enjoy a student to faculty ratio of 15 to 1.
Request InformationCeramic Engineering Careers in NJ
Some of the careers ceramic engineering majors go into include:
| Job Title | NJ Job Growth | NJ Median Salary |
|---|---|---|
| Engineering Professors | 11% | $0 |
| Architectural and Engineering Managers | 9% | $153,720 |
| Materials Engineers | 6% | $87,750 |
Related Majors in New Jersey
Below are some popular majors in the state that are similar to ceramic engineering.
| Major | Annual Graduates in NJ |
|---|---|
| Mechanical Engineering | 945 |
| Electrical Engineering | 761 |
| Civil Engineering | 670 |
| Biomedical Engineering | 407 |
| Chemical Engineering | 394 |
| Computer Engineering | 350 |
| Systems Engineering | 287 |
| General Engineering | 252 |
View all majors related to Ceramic Engineering
Explore Major by State
Alabama
Arkansas
Connecticut
Florida
Idaho
Iowa
Louisiana
Massachusetts
Mississippi
Nebraska
New Jersey
North Carolina
Oklahoma
Rhode Island
Tennessee
Vermont
West Virginia
View Nationwide Ceramic Engineering Report
References
More about our data sources and methodologies.

