Social Work at Utah Valley University
What traits are you looking for in a school for Social Work, you may want to check out the program at Utah Valley University. Get started with the following essential facts.
Utah Valley University sits in Orem, UT.
For the most recent IPEDS reporting year, 129 social work graduations were recorded at Utah Valley University.
Featured schools near , edit
Online & Distance Learning at Utah Valley University
Many students take online classes at Utah Valley University. Of 46,807 students, 6,655 (14%) were enrolled entirely in distance education and 15,106 (32%) took at least some classes online.
Social Work Rankings at Utah Valley University
These rankings give you a sense of how Utah Valley University’s Social Work program against other schools offering the same major.
Bachelor’s-Level Rankings
| Ranking | Scope | Rank |
|---|---|---|
| Best Schools (Quality) | Utah | #3 of 8 |
| Best Value | Utah | #3 of 8 |
| Best Schools (Quality) | Rocky Mountains (Region) | #6 of 26 |
| Best Value | Rocky Mountains (Region) | #6 of 26 |
| Best Value | Nationwide | #52 of 567 |
| Best Schools (Quality) | Nationwide | #210 of 570 |
Master’s-Level Rankings
| Ranking | Scope | Rank |
|---|---|---|
| Best Schools (Quality) | Utah | #3 of 8 |
| Best Value | Utah | #3 of 8 |
| Best Schools (Quality) | Rocky Mountains (Region) | #6 of 26 |
| Best Value | Rocky Mountains (Region) | #6 of 26 |
| Best Value | Nationwide | #52 of 567 |
| Best Schools (Quality) | Nationwide | #210 of 570 |
Earnings for Social Work Graduates from Utah Valley University
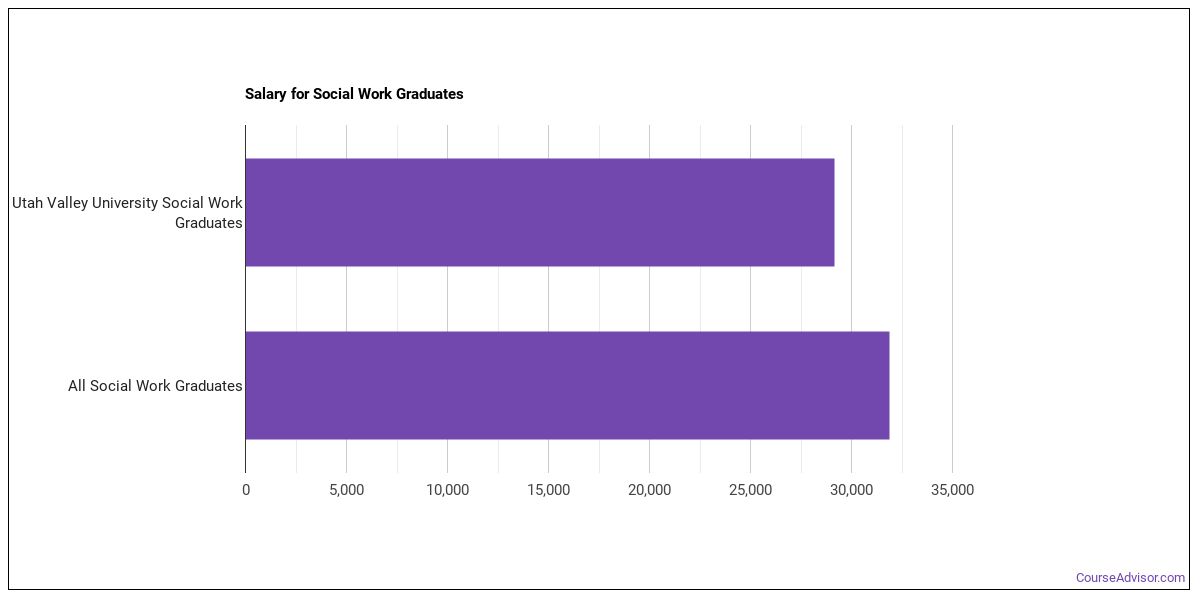
Students who complete Utah Valley University’s Social Work program report the following median earnings (per the U.S. Department of Education’s College Scorecard):
| Years After Graduation | Median Earnings |
|---|---|
| 1 year | $29,165 |
| 2 years | $33,459 |
| 3 years | $41,850 |
| 4 years | $47,214 |
| 5 years | $51,140 |
How does this compare to the school overall? Four years after graduating, Social Work graduates from Utah Valley University report median earnings of $47,214, compared with $53,268 for all Utah Valley University graduates — about 11% lower than the school-wide median.

Median Debt at Graduation
Typical debt at graduation for Social Work graduates from Utah Valley University comes in at $20,000.
Student Demographics & Diversity
The following sections describe the composition of Social Work graduates at Utah Valley University, broken down by degree level.
Across all degree levels, Social Work graduates at Utah Valley University are 81% women (105) and 19% men (24).
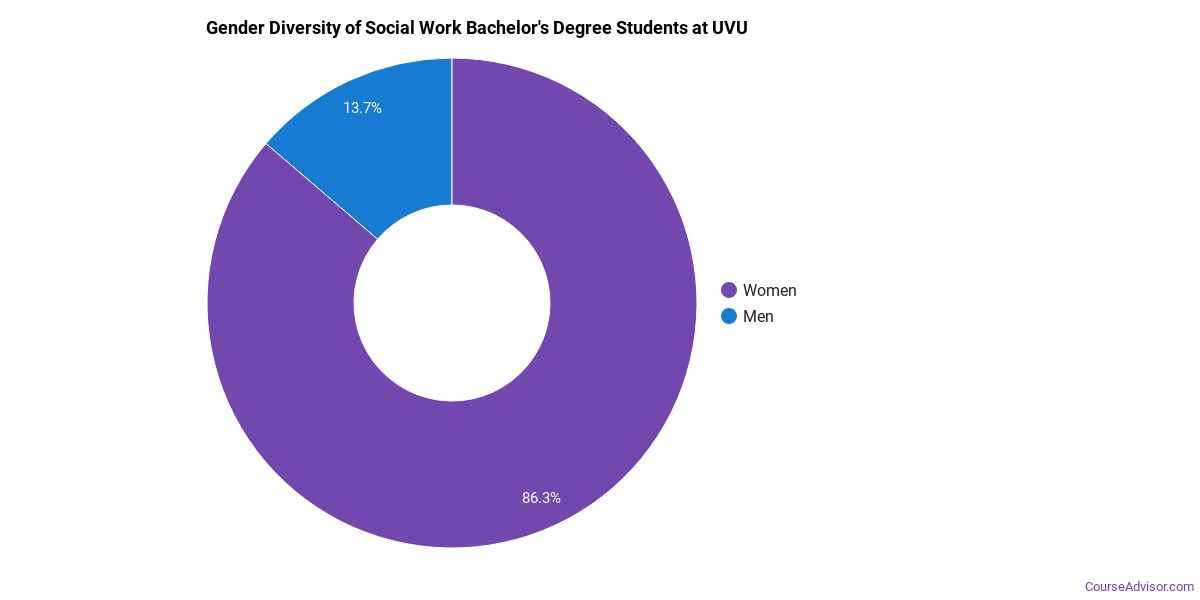
Social Work Bachelor’s Program at Utah Valley University
Of the 49 bachelor’s social work degrees awarded at Utah Valley University, 78% were women (38) and 22% were men (11).
The following table and chart show the race/ethnicity of Social Work bachelor’s degree recipients at Utah Valley University.
| Race / Ethnicity | Number of Graduates |
|---|---|
| White | 39 |
| Hispanic / Latino | 4 |
| Black / African American | 2 |
| Two or More Races | 4 |
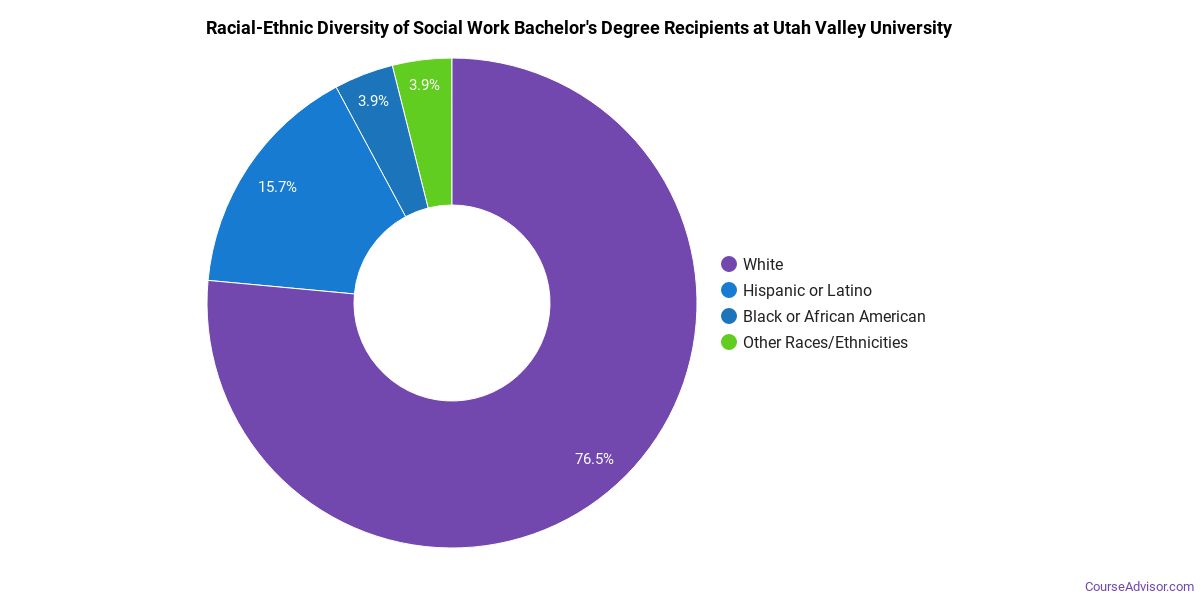
Minority students account for 20% of Social Work bachelor’s degree recipients at Utah Valley University, lower than the national average of 48%.*
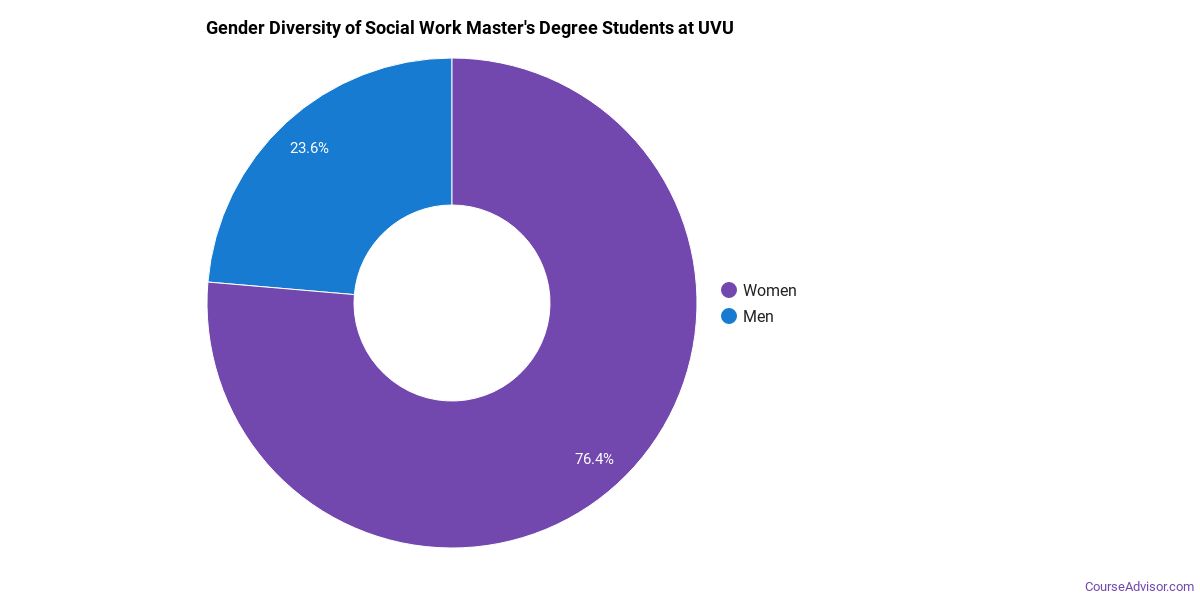
Social Work Master’s Program at Utah Valley University
Of the 80 master’s social work graduates at Utah Valley University, 84% were women (67) and 16% were men (13).
The following table and chart show the race/ethnicity of Social Work master’s degree recipients at Utah Valley University.
| Race / Ethnicity | Number of Graduates |
|---|---|
| White | 61 |
| Hispanic / Latino | 11 |
| American Indian / Alaska Native | 1 |
| Two or More Races | 4 |
| International (Nonresident) | 1 |
| Unknown | 2 |
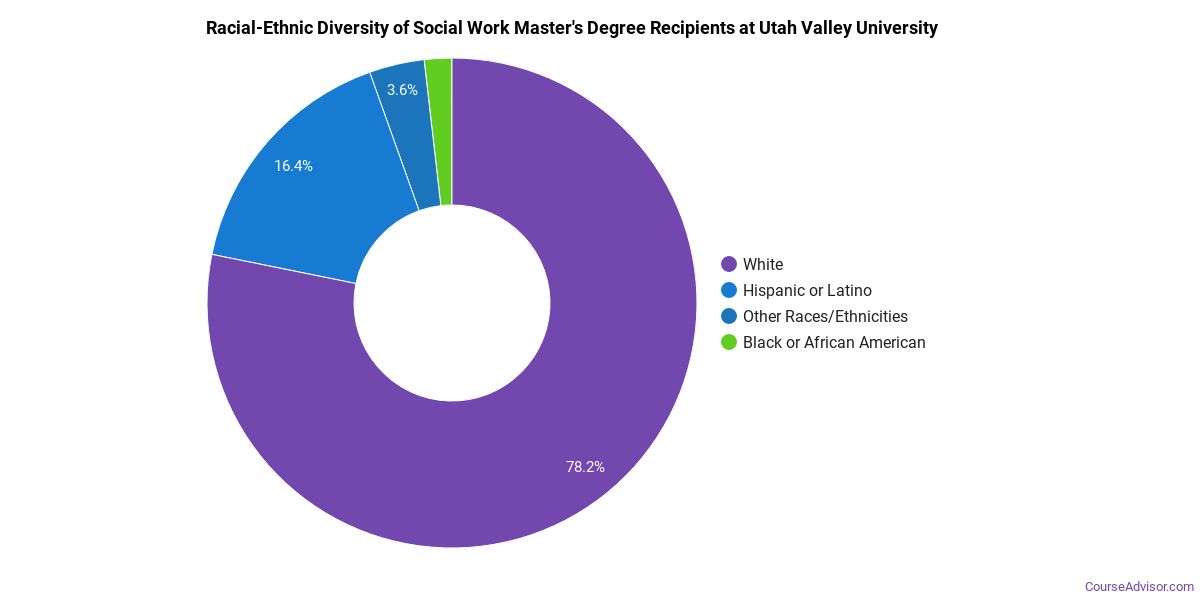
Racial-ethnic minorities make up 20% of Social Work master’s degree recipients at Utah Valley University, lower than the national average of 42%.*
*The racial-ethnic minorities figure is the total number of graduates minus White, international (nonresident), and unknown-race graduates.
More Specific Social Work Concentrations at Utah Valley University
This Social Work program at Utah Valley University includes the following sub-specializations:
| Concentration | Graduates |
|---|---|
| Social Work | 108 |
| Other Social Work | 21 |
Top-Paying Careers for Social Work Graduates
Graduates of the Social Work program at Utah Valley University work across a variety of fields. The table below ranks the top-paying careers for Social Work majors, ordered by median annual salary:
| Occupation | Nationwide Median Wage |
|---|---|
| Social and Community Service Managers | $156,089 |
| Counselors, All Other | $81,766 |
| Healthcare Social Workers | $78,044 |
| Marriage and Family Therapists | $74,325 |
| Social Work Teachers, Postsecondary | $65,510 |
| Social Workers, All Other | $62,827 |
| Mental Health and Substance Abuse Social Workers | $58,560 |
| Child, Family, and School Social Workers | $41,658 |
| Probation Officers and Correctional Treatment Specialists | $40,804 |
References
- IPEDS — Integrated Postsecondary Education Data System
- U.S. Department of Education — College Scorecard
- O*NET Online (Bureau of Labor Statistics)
- National Center for Education Statistics
More about our data sources and methodologies.
Course Advisor provides higher-education, college and university, degree, program, career, salary, and other helpful information to students, faculty, institutions, and other internet audiences. Presented information and data are subject to change. Inclusion on this website does not imply or represent a direct relationship with the company, school, or brand. Information, though believed correct at time of publication, may not be correct, and no warranty is provided. Contact the schools to verify any information before relying on it. Financial aid may be available for those who qualify. The displayed options may include sponsored or recommended results, not necessarily based on your preferences.
© Course Advisor – All Rights Reserved.