Special Education at University of South Dakota
What traits are you looking for in a school for Special Education, consider the program at University of South Dakota. We’ve gathered the following information to help you decide.
University of South Dakota is located in Vermillion, SD.
In the most recent year for which we have data, 14 special education degrees were awarded at University of South Dakota.
Featured schools near , edit
Online & Distance Learning at University of South Dakota
Online coursework is an option at University of South Dakota. Among 10,619 students, 3,777 (36%) were enrolled entirely in distance education and 3,110 (29%) took at least some classes online.
Special Education Rankings at University of South Dakota
Rankings can help you compare University of South Dakota’s Special Education program against peer institutions.
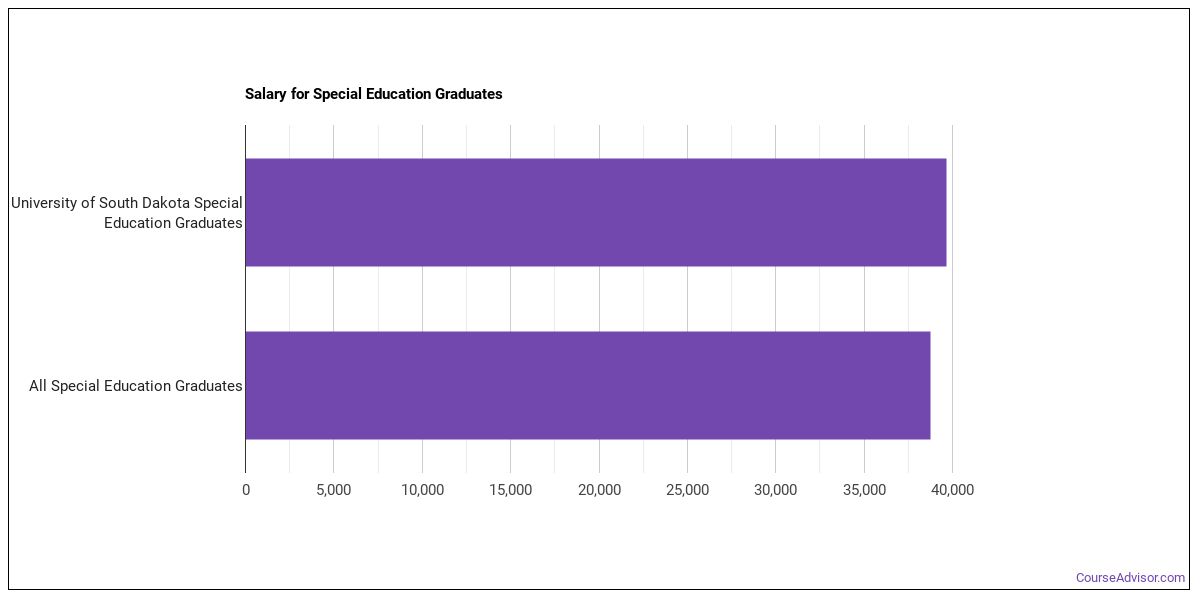
Earnings for Special Education Graduates from University of South Dakota
Those who finish University of South Dakota’s Special Education program earn at the following median levels (per the U.S. Department of Education’s College Scorecard):
| Years After Graduation | Median Earnings |
|---|---|
| 1 year | $39,667 |
| 2 years | $42,216 |
| 3 years | $39,766 |
| 4 years | $44,625 |
| 5 years | $48,365 |
How does this compare to the school overall? At the four-year mark, Special Education graduates from University of South Dakota earn a median of $44,625, compared with $60,001 for all University of South Dakota graduates — about 26% lower than the school-wide median.

Median Debt at Graduation
Median student loan debt for Special Education graduates from University of South Dakota stands at $27,000.
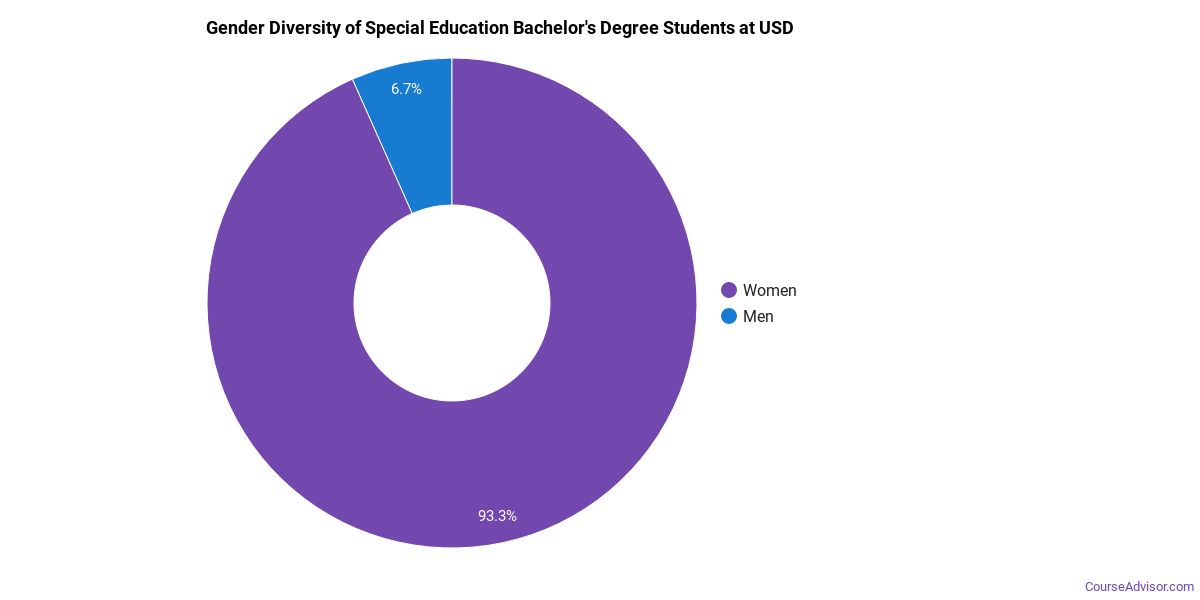
Student Demographics & Diversity
Below you’ll find the diversity of Special Education graduates at University of South Dakota, broken down by degree level.
Across all degree levels, Special Education graduates at University of South Dakota are 93% women (13) and 7% men (1).
Special Education Bachelor’s Program at University of South Dakota
Among the 5 bachelor’s special education graduates at University of South Dakota, 100% were women (5) and 0% were men (0).
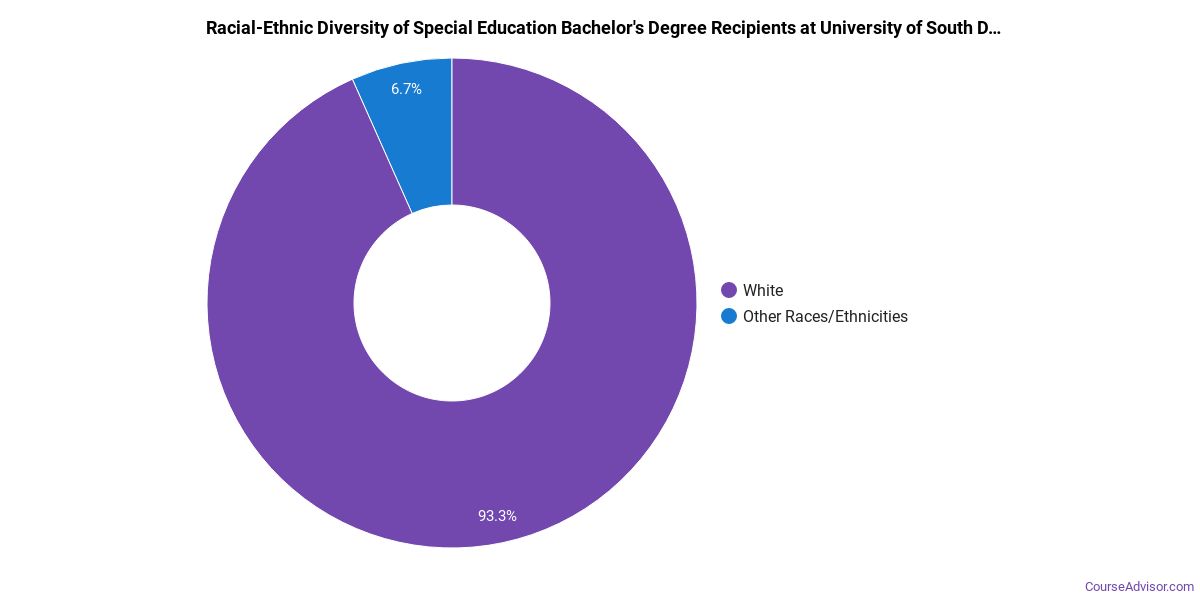
The following table and chart show the race/ethnicity of Special Education bachelor’s degree recipients at University of South Dakota.
| Race / Ethnicity | Number of Graduates |
|---|---|
| White | 5 |
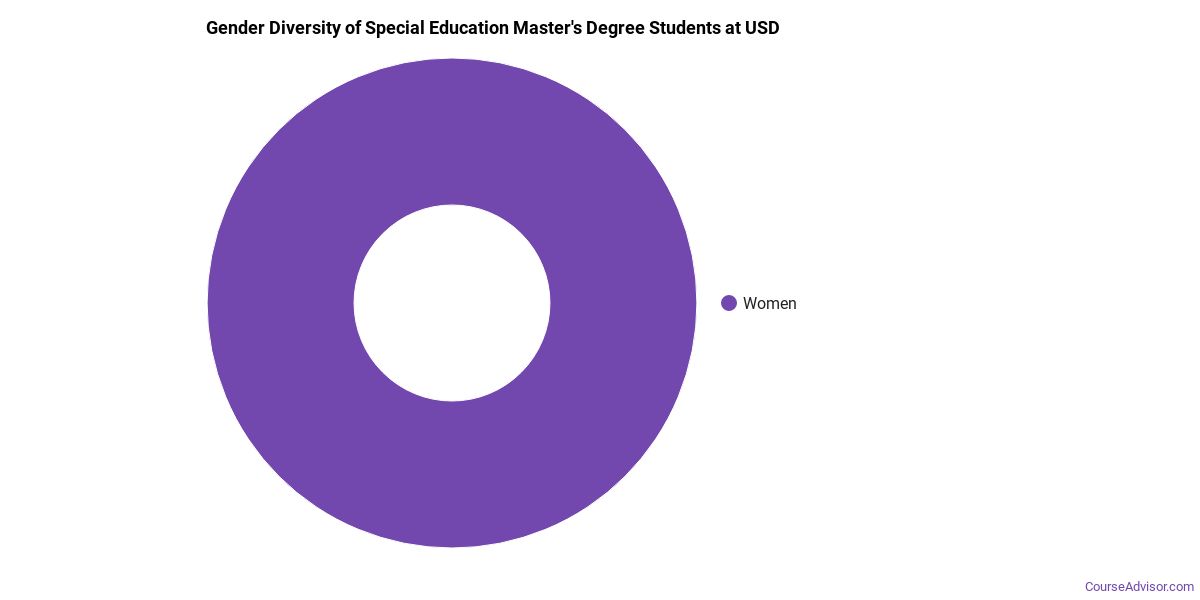
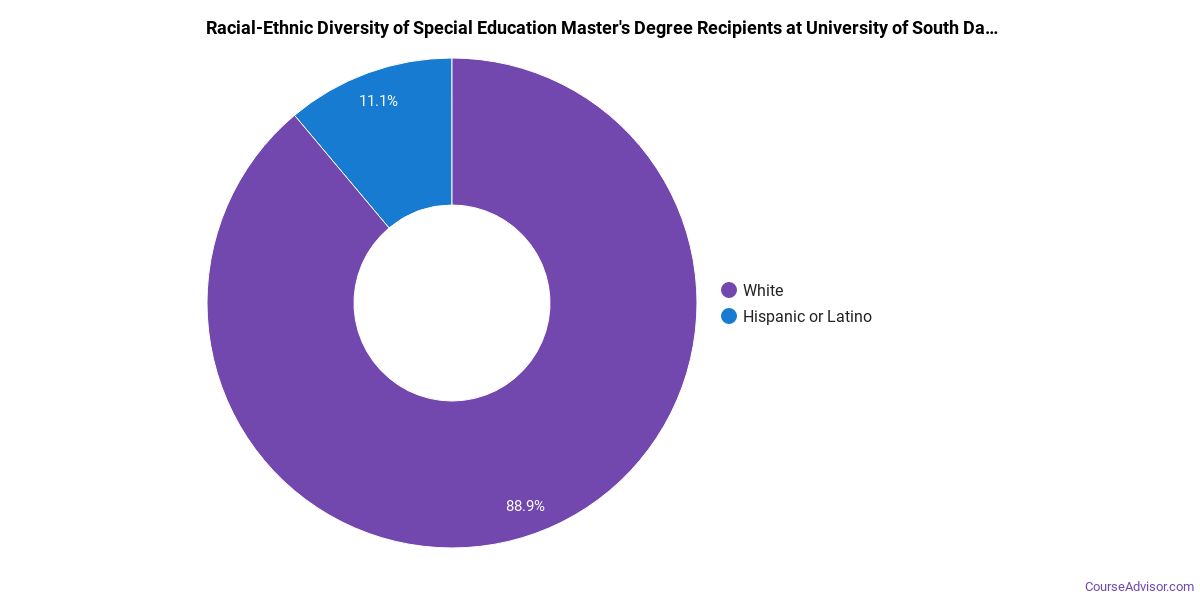
Special Education Master’s Program at University of South Dakota
Among the 9 master’s special education degrees awarded at University of South Dakota, 89% were women (8) and 11% were men (1).
The following table and chart show the race/ethnicity of Special Education master’s degree recipients at University of South Dakota.
| Race / Ethnicity | Number of Graduates |
|---|---|
| White | 9 |
*The racial-ethnic minorities figure is the total number of graduates minus White, international (nonresident), and unknown-race graduates.
More Specific Special Education Concentrations at University of South Dakota
This Special Education program at University of South Dakota offers more specialized concentrations:
| Concentration | Graduates |
|---|---|
| General Special Education | 14 |
Highest-Paying Careers for Special Education Graduates
Those who complete Special Education program at University of South Dakota go on to a range of careers. Below are the highest-paying careers for Special Education majors, ordered by median annual salary:
| Occupation | Nationwide Median Wage |
|---|---|
| Education Teachers, Postsecondary | $98,329 |
| Teaching Assistants, Special Education | $96,801 |
| Special Education Teachers, All Other | $86,208 |
| Special Education Teachers, Middle School | $80,694 |
| Special Education Teachers, Secondary School | $79,680 |
| Adapted Physical Education Specialists | $77,976 |
| Special Education Teachers, Kindergarten | $73,597 |
| Interpreters and Translators | $52,627 |
| Special Education Teachers, Elementary School | $50,045 |
| Special Education Teachers, Preschool | $35,173 |
References
- IPEDS — Integrated Postsecondary Education Data System
- U.S. Department of Education — College Scorecard
- O*NET Online (Bureau of Labor Statistics)
- National Center for Education Statistics
More about our data sources and methodologies.
Course Advisor provides higher-education, college and university, degree, program, career, salary, and other helpful information to students, faculty, institutions, and other internet audiences. Presented information and data are subject to change. Inclusion on this website does not imply or represent a direct relationship with the company, school, or brand. Information, though believed correct at time of publication, may not be correct, and no warranty is provided. Contact the schools to verify any information before relying on it. Financial aid may be available for those who qualify. The displayed options may include sponsored or recommended results, not necessarily based on your preferences.
© Course Advisor – All Rights Reserved.