Social Work at University of Rio Grande
What traits are you looking for in a school for Social Work, you may want to check out the program at University of Rio Grande. Get started with the following essential facts.
University of Rio Grande is located in Rio Grande, OH.
In the most recent year for which we have data, 7 social work degrees were granted at University of Rio Grande.
Featured schools near , edit
Online Class Availability at University of Rio Grande
Many students take online classes at University of Rio Grande. Of 2,258 students, 186 (8%) were enrolled entirely in distance education and 959 (42%) took at least some classes online.
Student Demographics & Diversity
Take a look at the composition of Social Work graduates at University of Rio Grande, by degree type.
Across all degree levels, Social Work graduates at University of Rio Grande are 100% women (7) and 0% men (0).
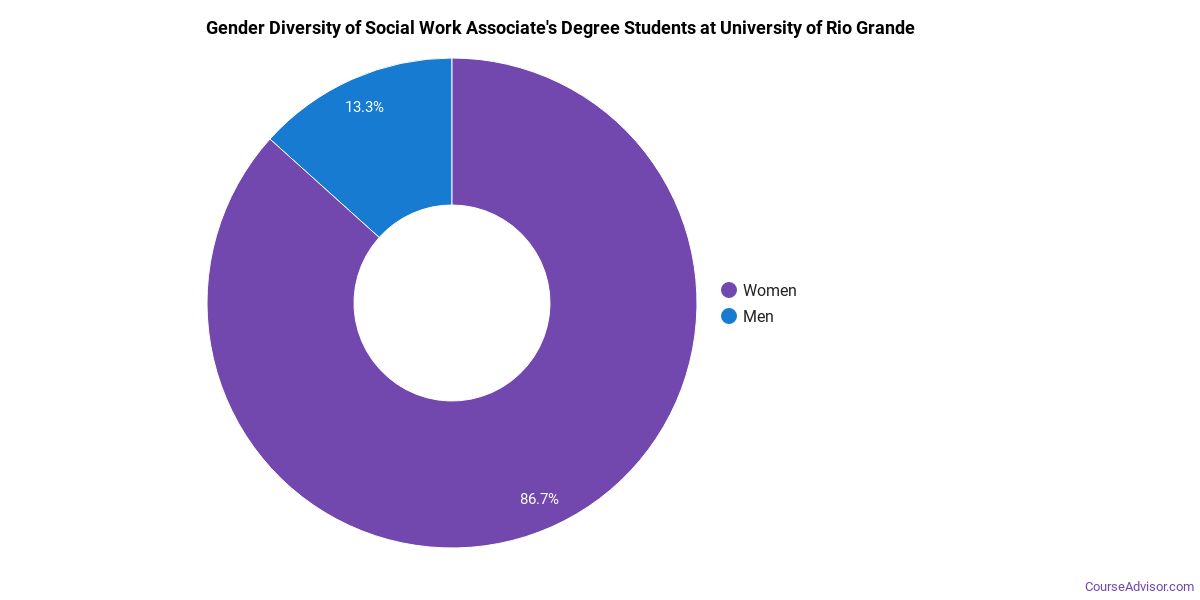
Social Work Associate’s Program at University of Rio Grande
Among the 4 associate’s social work graduates at University of Rio Grande, 100% were women (4) and 0% were men (0).
The following table and chart show the race/ethnicity of Social Work associate’s degree recipients at University of Rio Grande.
| Race / Ethnicity | Number of Graduates |
|---|---|
| White | 4 |

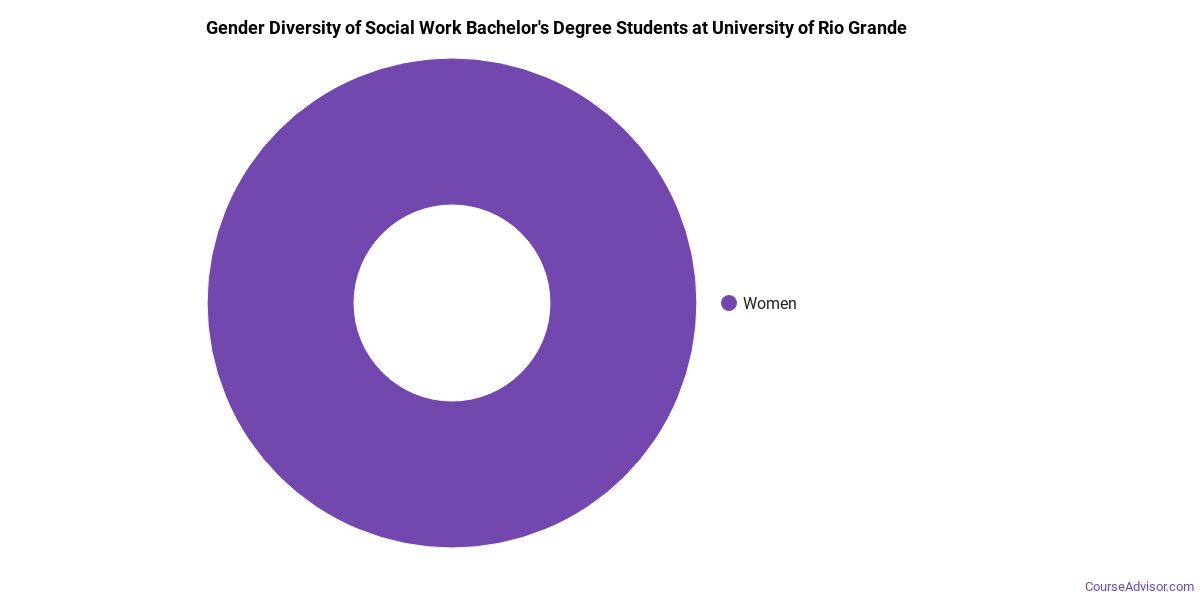
Social Work Bachelor’s Program at University of Rio Grande
Of the 3 bachelor’s social work graduates at University of Rio Grande, 100% were women (3) and 0% were men (0).
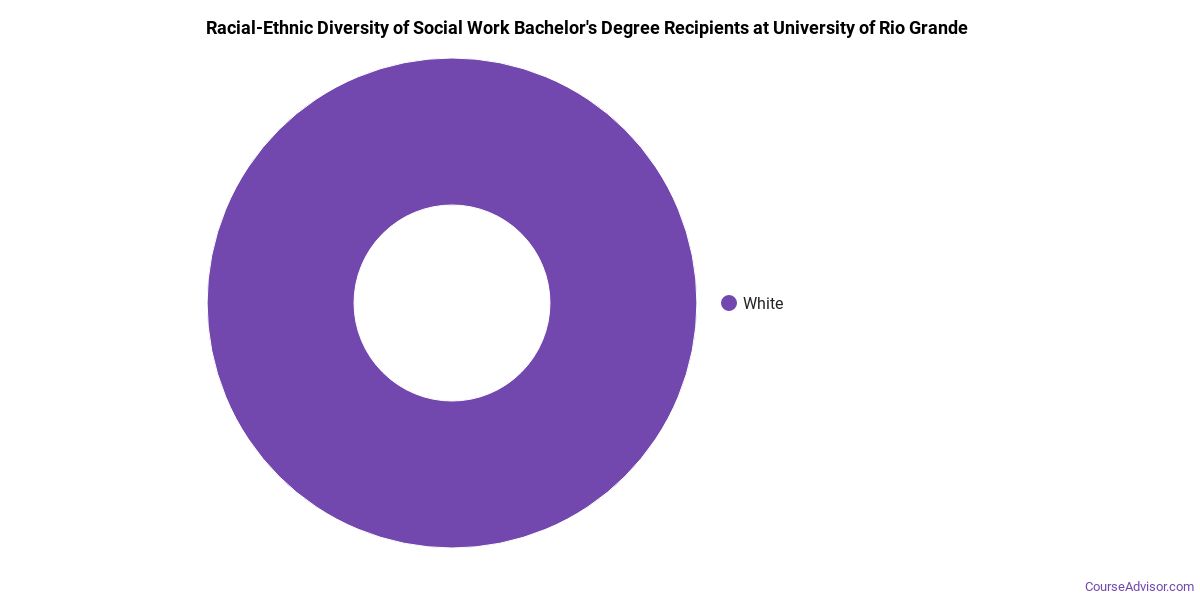
The following table and chart show the race/ethnicity of Social Work bachelor’s degree recipients at University of Rio Grande.
| Race / Ethnicity | Number of Graduates |
|---|---|
| White | 3 |
*The racial-ethnic minorities figure is the total number of graduates minus White, international (nonresident), and unknown-race graduates.
More Specific Social Work Concentrations at University of Rio Grande
The Social Work program at University of Rio Grande includes the following sub-specializations:
| Concentration | Graduates |
|---|---|
| Social Work | 7 |
Best-Paid Careers for Social Work Graduates
Those who complete Social Work program at University of Rio Grande pursue many career paths. Here are the best-paid careers for Social Work graduates, ordered by median annual salary:
| Occupation | Nationwide Median Wage |
|---|---|
| Social and Community Service Managers | $156,089 |
| Counselors, All Other | $81,766 |
| Healthcare Social Workers | $78,044 |
| Marriage and Family Therapists | $74,325 |
| Social Work Teachers, Postsecondary | $65,510 |
| Social Workers, All Other | $62,827 |
| Mental Health and Substance Abuse Social Workers | $58,560 |
| Child, Family, and School Social Workers | $41,658 |
| Probation Officers and Correctional Treatment Specialists | $40,804 |
References
- IPEDS — Integrated Postsecondary Education Data System
- U.S. Department of Education — College Scorecard
- O*NET Online (Bureau of Labor Statistics)
- National Center for Education Statistics
More about our data sources and methodologies.
Course Advisor provides higher-education, college and university, degree, program, career, salary, and other helpful information to students, faculty, institutions, and other internet audiences. Presented information and data are subject to change. Inclusion on this website does not imply or represent a direct relationship with the company, school, or brand. Information, though believed correct at time of publication, may not be correct, and no warranty is provided. Contact the schools to verify any information before relying on it. Financial aid may be available for those who qualify. The displayed options may include sponsored or recommended results, not necessarily based on your preferences.
© Course Advisor – All Rights Reserved.