Fine & Studio Arts at University of Pittsburgh-Pittsburgh Campus
If you plan to study Fine & Studio Arts, you may want to check out the program at University of Pittsburgh-Pittsburgh Campus. The following information will help you decide if it is a good fit for you.
University of Pittsburgh-Pittsburgh Campus is in Pittsburgh, PA.
For the most recent IPEDS reporting year, 40 fine & studio arts graduations were recorded at University of Pittsburgh-Pittsburgh Campus.
Featured schools near , edit
Studying Online at University of Pittsburgh-Pittsburgh Campus
Online coursework is an option at University of Pittsburgh-Pittsburgh Campus. Of 35,724 students, 1,465 (4%) were enrolled entirely in distance education and 6,044 (17%) took at least some classes online.
Fine & Studio Arts Rankings at University of Pittsburgh-Pittsburgh Campus
These rankings give you a sense of how University of Pittsburgh-Pittsburgh Campus’s Fine & Studio Arts program to other colleges that offer this major.
Bachelor’s-Level Rankings
| Ranking | Scope | Rank |
|---|---|---|
| Best Schools (Quality) | Pennsylvania | #2 of 29 |
| Best Schools (Quality) | Middle Atlantic (Region) | #7 of 122 |
| Best Value | Pennsylvania | #22 of 29 |
| Best Schools (Quality) | Nationwide | #34 of 666 |
| Best Value | Middle Atlantic (Region) | #91 of 121 |
| Best Value | Nationwide | #571 of 662 |
Master’s-Level Rankings
| Ranking | Scope | Rank |
|---|---|---|
| Best Schools (Quality) | Pennsylvania | #2 of 29 |
| Best Schools (Quality) | Middle Atlantic (Region) | #7 of 122 |
| Best Value | Pennsylvania | #22 of 29 |
| Best Schools (Quality) | Nationwide | #34 of 666 |
| Best Value | Middle Atlantic (Region) | #91 of 121 |
| Best Value | Nationwide | #571 of 662 |
Doctoral-Level Rankings
| Ranking | Scope | Rank |
|---|---|---|
| Best Schools (Quality) | Pennsylvania | #2 of 29 |
| Best Schools (Quality) | Middle Atlantic (Region) | #7 of 122 |
| Best Value | Pennsylvania | #22 of 29 |
| Best Schools (Quality) | Nationwide | #34 of 666 |
| Best Value | Middle Atlantic (Region) | #91 of 121 |
| Best Value | Nationwide | #571 of 662 |
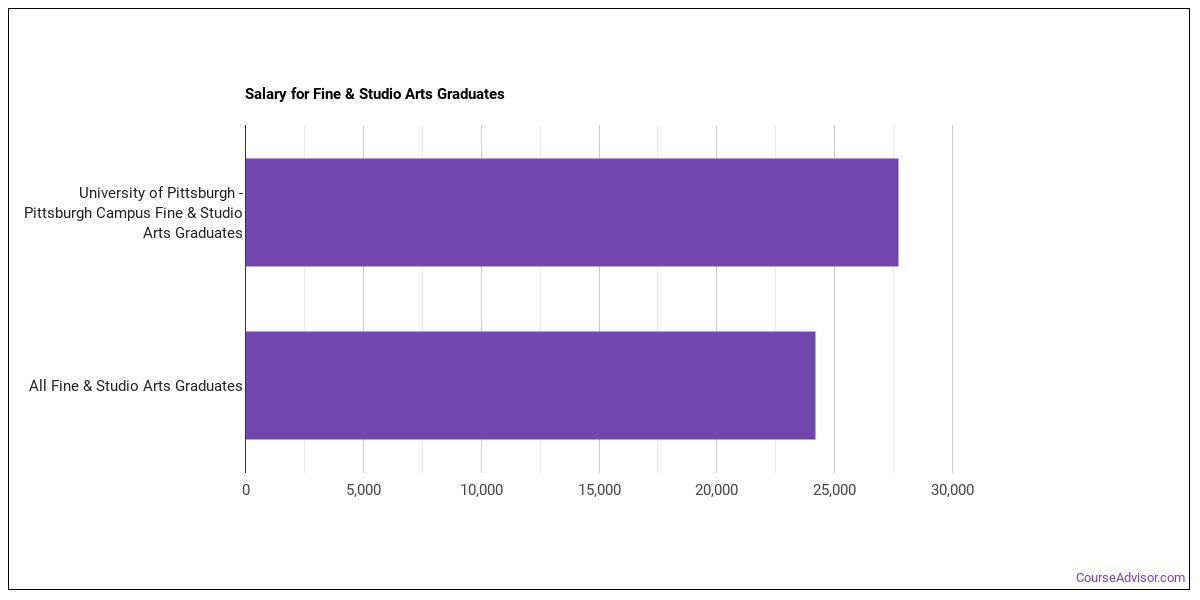
Earnings for Fine & Studio Arts Graduates from University of Pittsburgh-Pittsburgh Campus
Graduates of University of Pittsburgh-Pittsburgh Campus’s Fine & Studio Arts program earn the following amounts (per the U.S. Department of Education’s College Scorecard):
| Years After Graduation | Median Earnings |
|---|---|
| 1 year | $27,727 |
| 2 years | $32,925 |
| 3 years | $43,293 |
| 4 years | $53,037 |
| 5 years | $59,030 |
How do these earnings stack up against the rest of the school? Four years out, Fine & Studio Arts graduates from University of Pittsburgh-Pittsburgh Campus earn a median of $53,037, compared with $69,239 for all University of Pittsburgh-Pittsburgh Campus graduates — about 23% lower than the school-wide median.

Median Debt at Graduation
Typical debt at graduation for Fine & Studio Arts graduates from University of Pittsburgh-Pittsburgh Campus is $23,477.
Student Demographics & Diversity
The following sections describe the student demographics for Fine & Studio Arts graduates at University of Pittsburgh-Pittsburgh Campus, broken down by degree level.
Looking at the program as a whole, Fine & Studio Arts graduates at University of Pittsburgh-Pittsburgh Campus are 88% women (35) and 12% men (5).
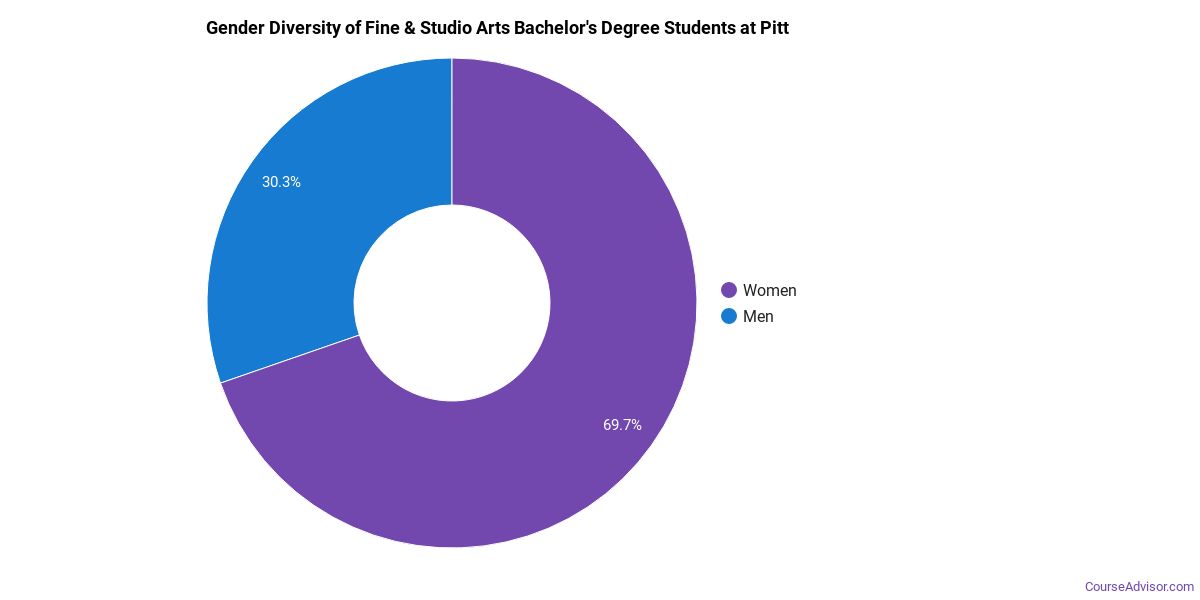
Fine & Studio Arts Bachelor’s Program at University of Pittsburgh-Pittsburgh Campus
Among the 37 bachelor’s fine & studio arts graduates at University of Pittsburgh-Pittsburgh Campus, 86% were women (32) and 14% were men (5).
The following table and chart show the race/ethnicity of Fine & Studio Arts bachelor’s degree recipients at University of Pittsburgh-Pittsburgh Campus.
| Race / Ethnicity | Number of Graduates |
|---|---|
| White | 20 |
| Hispanic / Latino | 1 |
| Black / African American | 2 |
| Asian | 7 |
| Two or More Races | 3 |
| International (Nonresident) | 4 |
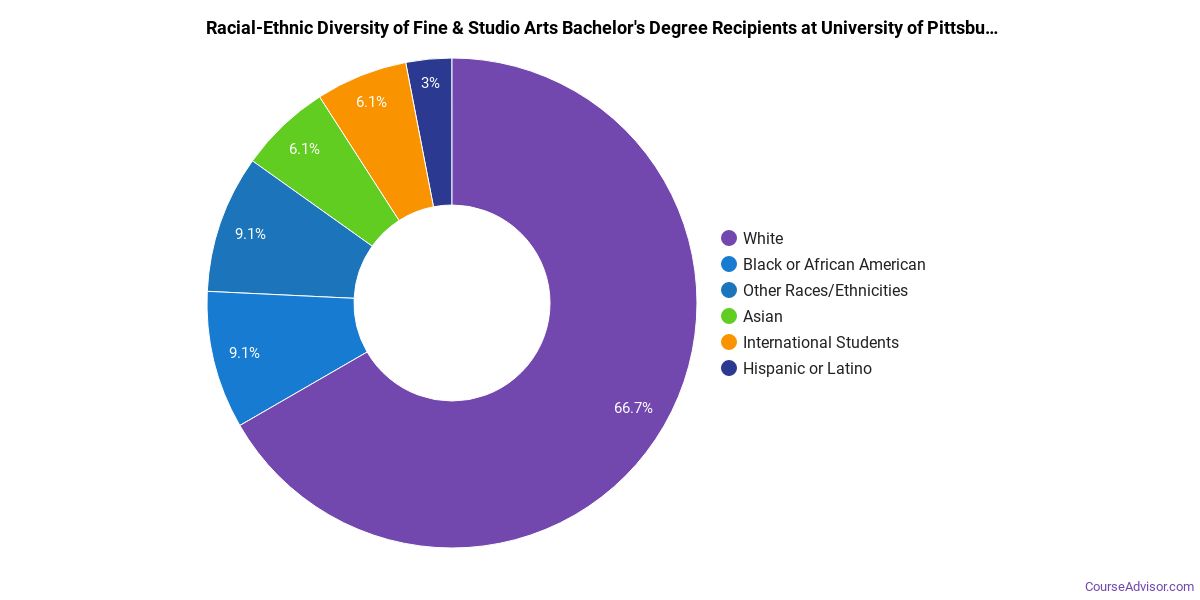
Minority students account for 35% of Fine & Studio Arts bachelor’s degree recipients at University of Pittsburgh-Pittsburgh Campus, below the national average of 40%.*
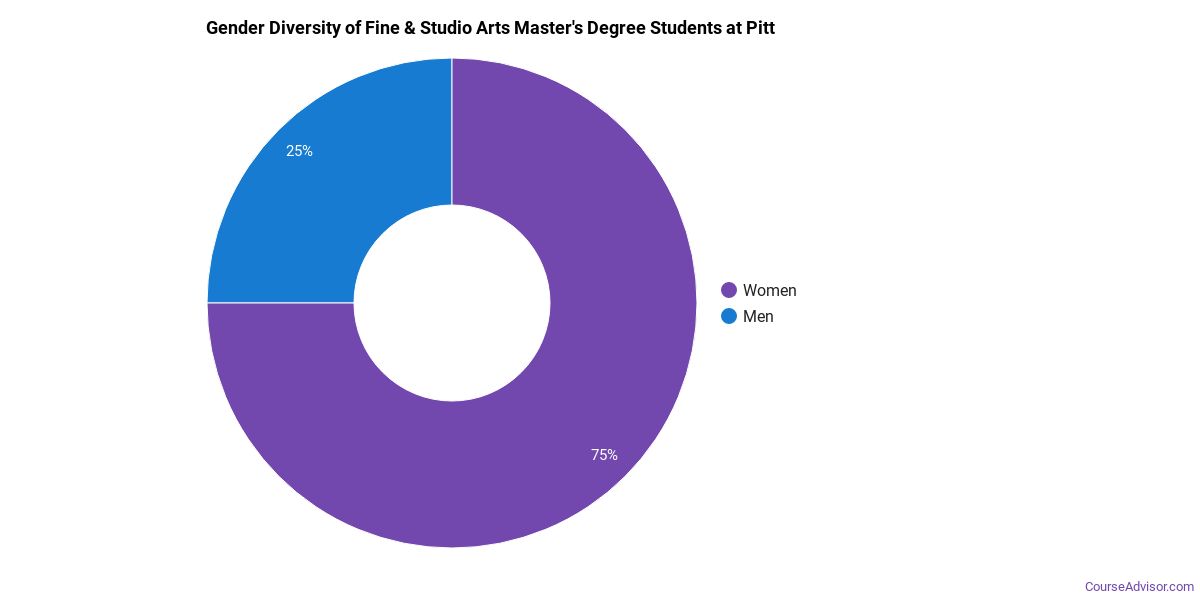
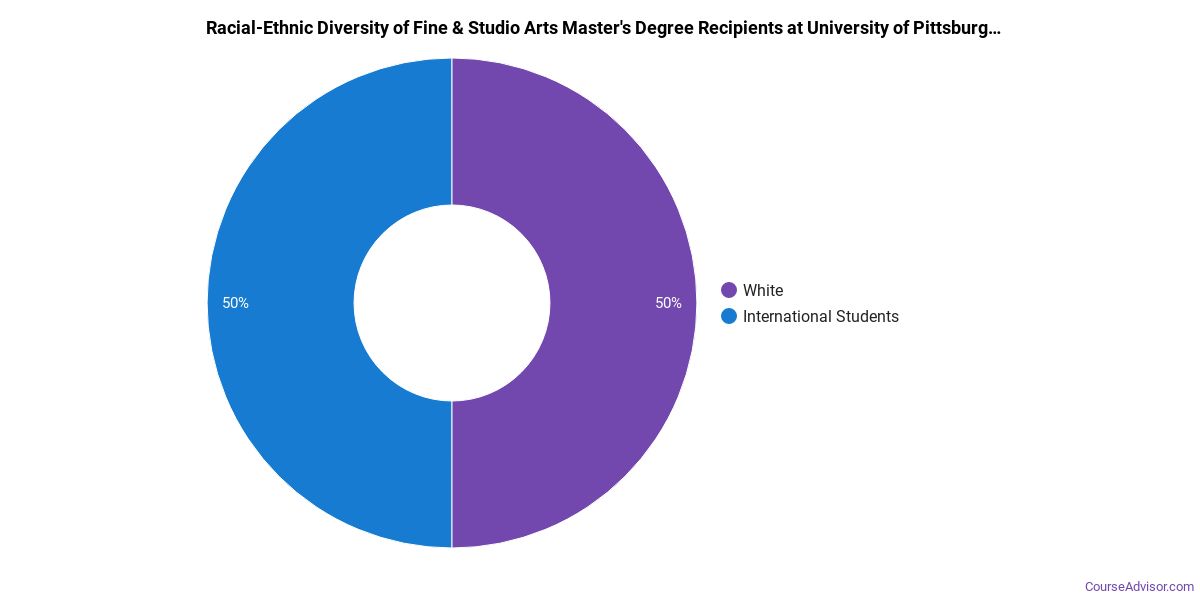
Fine & Studio Arts Master’s Program at University of Pittsburgh-Pittsburgh Campus
Among the 1 master’s fine & studio arts graduates at University of Pittsburgh-Pittsburgh Campus, 100% were women (1) and 0% were men (0).
The following table and chart show the race/ethnicity of Fine & Studio Arts master’s degree recipients at University of Pittsburgh-Pittsburgh Campus.
| Race / Ethnicity | Number of Graduates |
|---|---|
| White | 1 |
Fine & Studio Arts Doctoral Program at University of Pittsburgh-Pittsburgh Campus
Among the 2 doctoral fine & studio arts graduates at University of Pittsburgh-Pittsburgh Campus, 100% were women (2) and 0% were men (0).

The following table and chart show the race/ethnicity of Fine & Studio Arts doctoral degree recipients at University of Pittsburgh-Pittsburgh Campus.
| Race / Ethnicity | Number of Graduates |
|---|---|
| White | 2 |

*The racial-ethnic minorities figure is the total number of graduates minus White, international (nonresident), and unknown-race graduates.
More Specific Fine & Studio Arts Concentrations at University of Pittsburgh-Pittsburgh Campus
The Fine & Studio Arts program at University of Pittsburgh-Pittsburgh Campus breaks down into more specific concentrations:
| Concentration | Graduates |
|---|---|
| Fine Arts | 15 |
| Art History | 25 |
Top-Paying Careers for Fine & Studio Arts Graduates
Those who complete Fine & Studio Arts program at University of Pittsburgh-Pittsburgh Campus go on to a range of careers. Here are the highest-paying careers for Fine & Studio Arts majors, ordered by median annual salary:
| Occupation | Nationwide Median Wage |
|---|---|
| Appraisers of Personal and Business Property | $118,242 |
| Art Directors | $103,285 |
| Museum Technicians and Conservators | $96,273 |
| Artists and Related Workers, All Other | $83,610 |
| Curators | $79,764 |
| Secondary School Teachers, Except Special and Career/Technical Education | $77,927 |
| Craft Artists | $76,826 |
| Photographers | $75,743 |
| Fine Artists, Including Painters, Sculptors, and Illustrators | $69,338 |
| Jewelers and Precious Stone and Metal Workers | $67,147 |
References
- IPEDS — Integrated Postsecondary Education Data System
- U.S. Department of Education — College Scorecard
- O*NET Online (Bureau of Labor Statistics)
- National Center for Education Statistics
More about our data sources and methodologies.
Course Advisor provides higher-education, college and university, degree, program, career, salary, and other helpful information to students, faculty, institutions, and other internet audiences. Presented information and data are subject to change. Inclusion on this website does not imply or represent a direct relationship with the company, school, or brand. Information, though believed correct at time of publication, may not be correct, and no warranty is provided. Contact the schools to verify any information before relying on it. Financial aid may be available for those who qualify. The displayed options may include sponsored or recommended results, not necessarily based on your preferences.
© Course Advisor – All Rights Reserved.