Criminal Justice & Corrections at University of New Haven
If you are interested in studying Criminal Justice & Corrections, consider the program at University of New Haven. Get started with the following essential facts.
University of New Haven sits in West Haven, CT.
During the most recent reporting year, 409 criminal justice & corrections degrees were awarded at University of New Haven.
Featured schools near , edit
Online & Distance Learning at University of New Haven
Online coursework is an option at University of New Haven. Among 9,229 students, 974 (11%) studied exclusively online and 3,314 (36%) took at least some classes online.
Criminal Justice & Corrections Rankings at University of New Haven
Rankings can help you compare University of New Haven’s Criminal Justice & Corrections program against other schools offering the same major.
Bachelor’s-Level Rankings
| Ranking | Scope | Rank |
|---|---|---|
| Best Schools (Quality) | Connecticut | #3 of 11 |
| Best Value | Connecticut | #9 of 11 |
| Best Schools (Quality) | New England (Region) | #11 of 66 |
| Best Value | New England (Region) | #60 of 67 |
| Best Schools (Quality) | Nationwide | #81 of 1,205 |
| Best Value | Nationwide | #1185 of 1,206 |
Master’s-Level Rankings
| Ranking | Scope | Rank |
|---|---|---|
| Best Schools (Quality) | Connecticut | #3 of 11 |
| Best Value | Connecticut | #9 of 11 |
| Best Schools (Quality) | New England (Region) | #11 of 66 |
| Best Value | New England (Region) | #60 of 67 |
| Best Schools (Quality) | Nationwide | #81 of 1,205 |
| Best Value | Nationwide | #1185 of 1,206 |
Doctoral-Level Rankings
| Ranking | Scope | Rank |
|---|---|---|
| Best Schools (Quality) | Connecticut | #3 of 11 |
| Best Value | Connecticut | #9 of 11 |
| Best Schools (Quality) | New England (Region) | #11 of 66 |
| Best Value | New England (Region) | #60 of 67 |
| Best Schools (Quality) | Nationwide | #81 of 1,205 |
| Best Value | Nationwide | #1185 of 1,206 |
Associate-Level Rankings
| Ranking | Scope | Rank |
|---|---|---|
| Best Schools (Quality) | Connecticut | #3 of 11 |
| Best Value | Connecticut | #9 of 11 |
| Best Schools (Quality) | New England (Region) | #11 of 66 |
| Best Value | New England (Region) | #60 of 67 |
| Best Schools (Quality) | Nationwide | #81 of 1,205 |
| Best Value | Nationwide | #1185 of 1,206 |
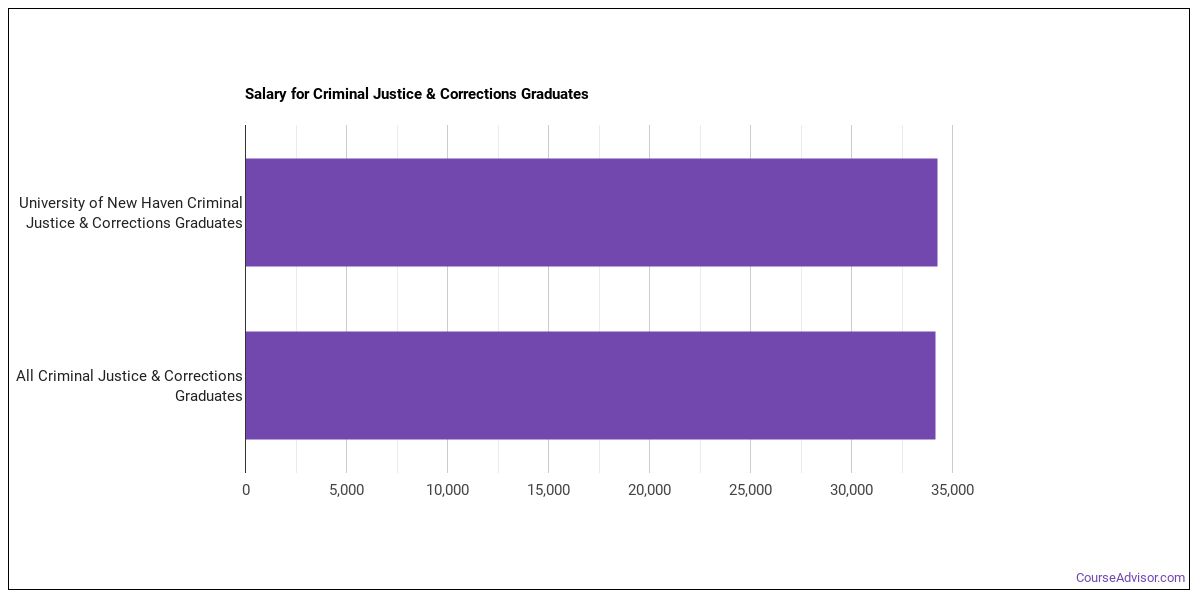
Earnings for Criminal Justice & Corrections Graduates from University of New Haven
Students who complete University of New Haven’s Criminal Justice & Corrections program report the following median earnings (per the U.S. Department of Education’s College Scorecard):
| Years After Graduation | Median Earnings |
|---|---|
| 1 year | $37,248 |
| 2 years | $36,602 |
| 3 years | $47,864 |
| 4 years | $56,552 |
| 5 years | $59,882 |
How do these earnings stack up against the rest of the school? Four years out, Criminal Justice & Corrections graduates from University of New Haven earn a median of $56,552, compared with $60,047 for all University of New Haven graduates — about 6% lower than the school-wide median.

Median Debt at Graduation
Median student loan debt for Criminal Justice & Corrections graduates from University of New Haven is $27,000.
Student Demographics & Diversity
Take a look at the student demographics for Criminal Justice & Corrections graduates at University of New Haven, broken down by degree level.
Program-wide, Criminal Justice & Corrections graduates at University of New Haven are 63% women (256) and 37% men (153).
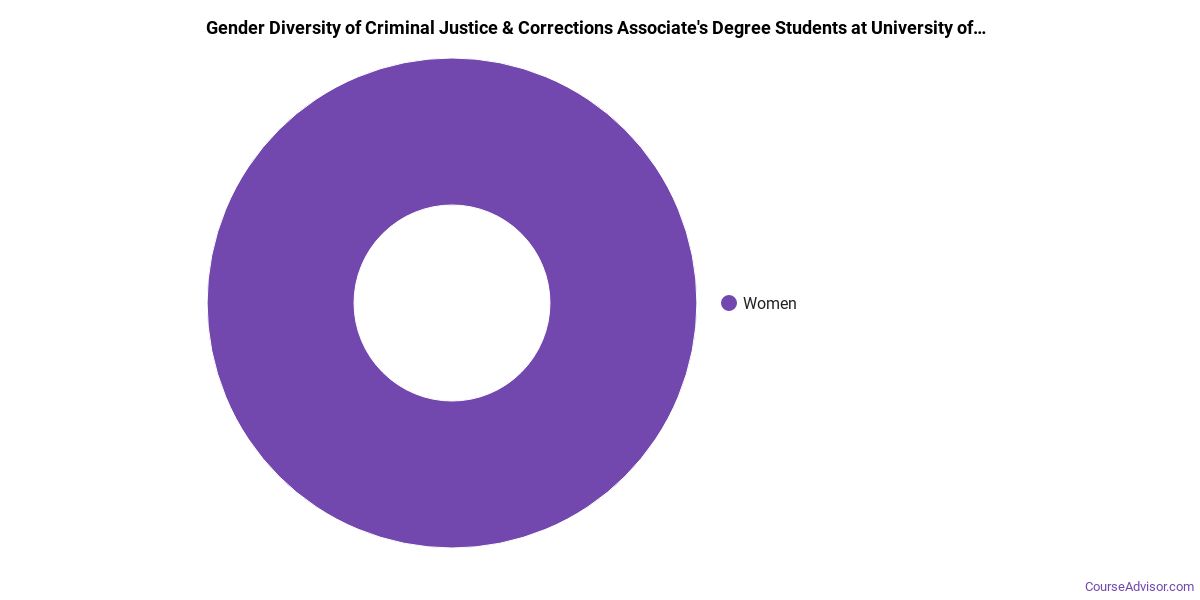
Criminal Justice & Corrections Associate’s Program at University of New Haven
Among the 2 associate’s criminal justice & corrections graduates at University of New Haven, 50% were women (1) and 50% were men (1).
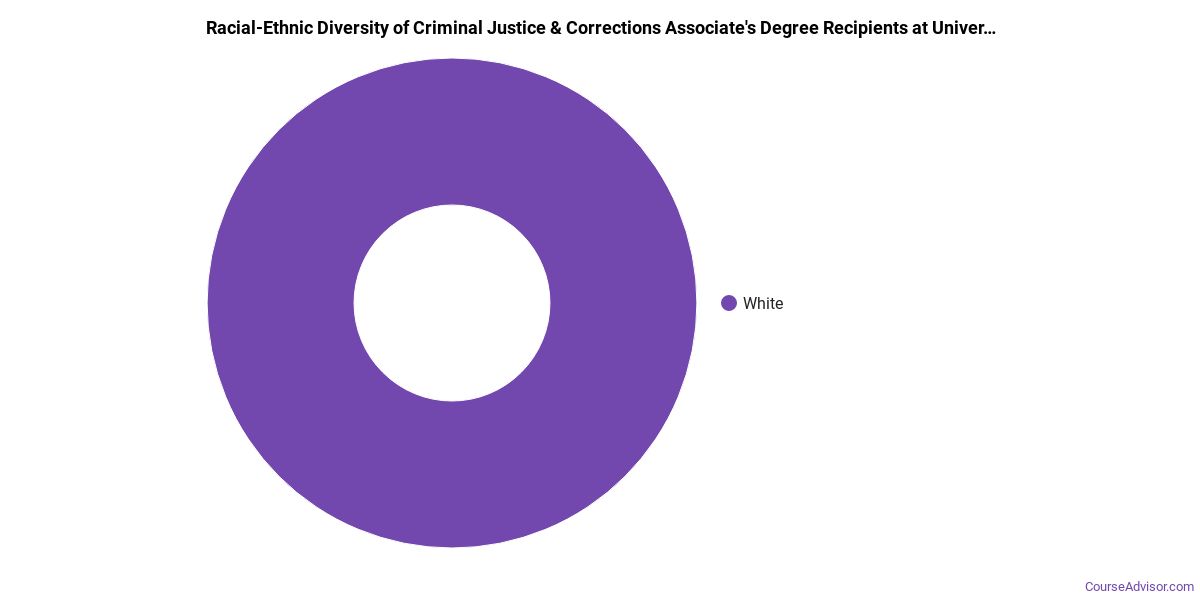
The following table and chart show the race/ethnicity of Criminal Justice & Corrections associate’s degree recipients at University of New Haven.
| Race / Ethnicity | Number of Graduates |
|---|---|
| White | 2 |
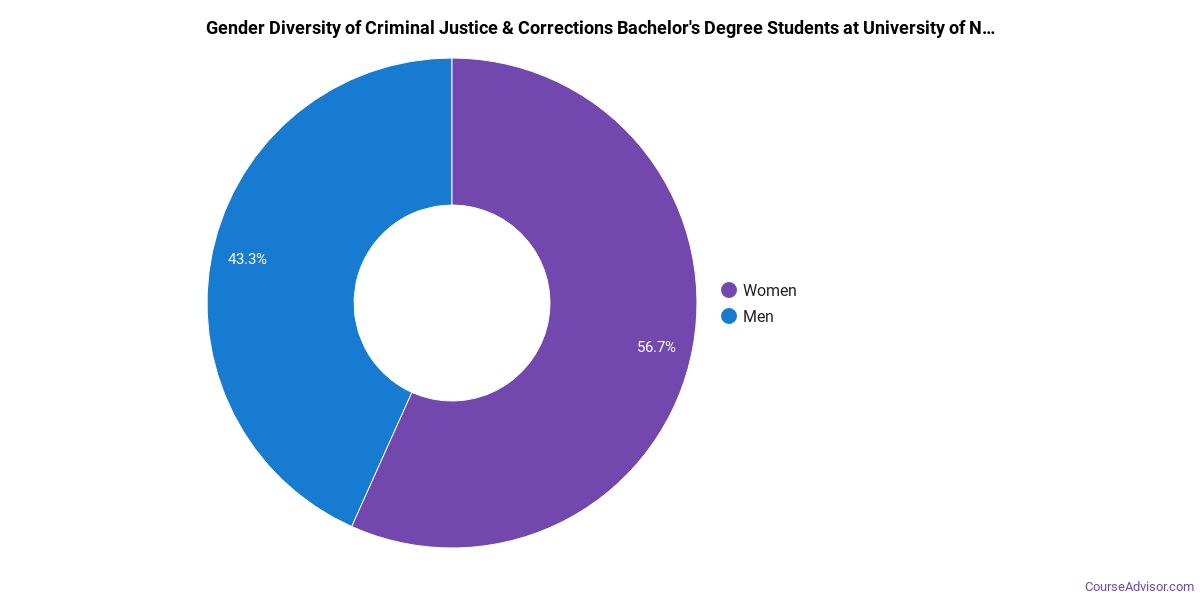
Criminal Justice & Corrections Bachelor’s Program at University of New Haven
Among the 218 bachelor’s criminal justice & corrections graduates at University of New Haven, 64% were women (139) and 36% were men (79).
The following table and chart show the race/ethnicity of Criminal Justice & Corrections bachelor’s degree recipients at University of New Haven.
| Race / Ethnicity | Number of Graduates |
|---|---|
| White | 134 |
| Hispanic / Latino | 45 |
| Black / African American | 16 |
| Asian | 7 |
| Two or More Races | 3 |
| International (Nonresident) | 1 |
| Unknown | 12 |
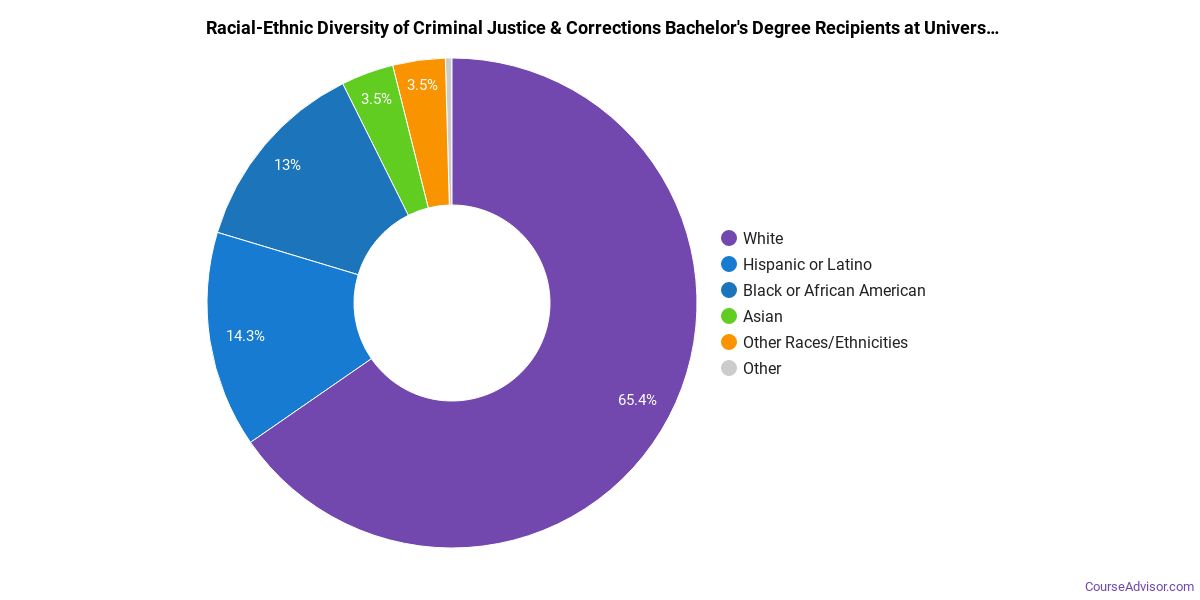
Racial-ethnic minorities make up 33% of Criminal Justice & Corrections bachelor’s degree recipients at University of New Haven, lower than the national average of 52%.*
Criminal Justice & Corrections Master’s Program at University of New Haven
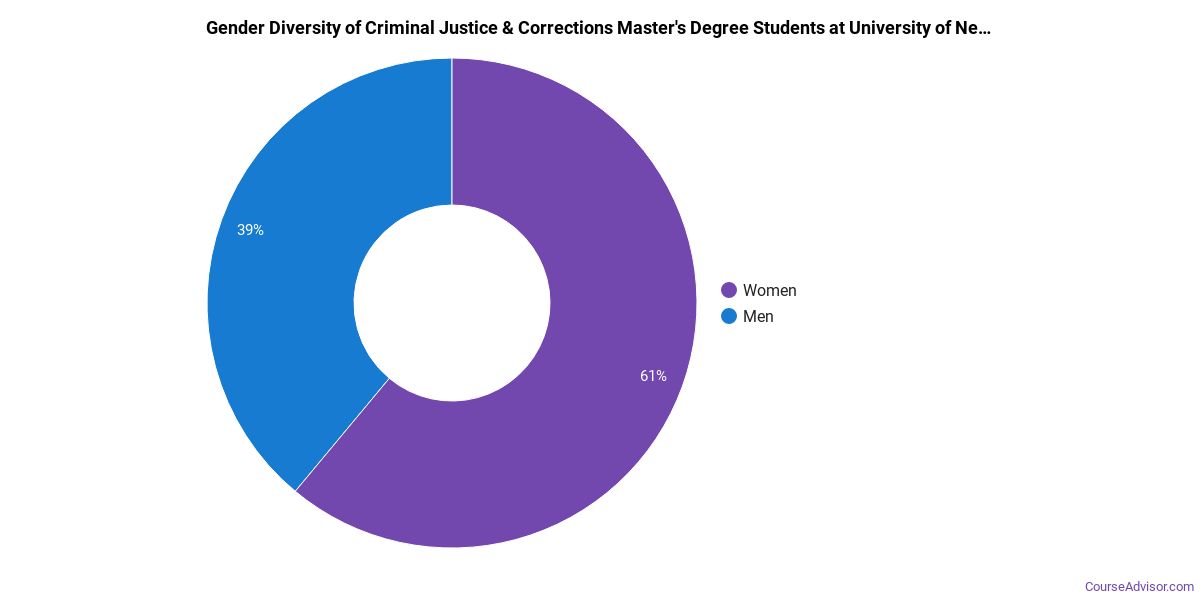
Among the 151 master’s criminal justice & corrections graduates at University of New Haven, 60% were women (90) and 40% were men (61).
The following table and chart show the race/ethnicity of Criminal Justice & Corrections master’s degree recipients at University of New Haven.
| Race / Ethnicity | Number of Graduates |
|---|---|
| White | 88 |
| Hispanic / Latino | 27 |
| Black / African American | 14 |
| American Indian / Alaska Native | 4 |
| Two or More Races | 5 |
| International (Nonresident) | 11 |
| Unknown | 2 |
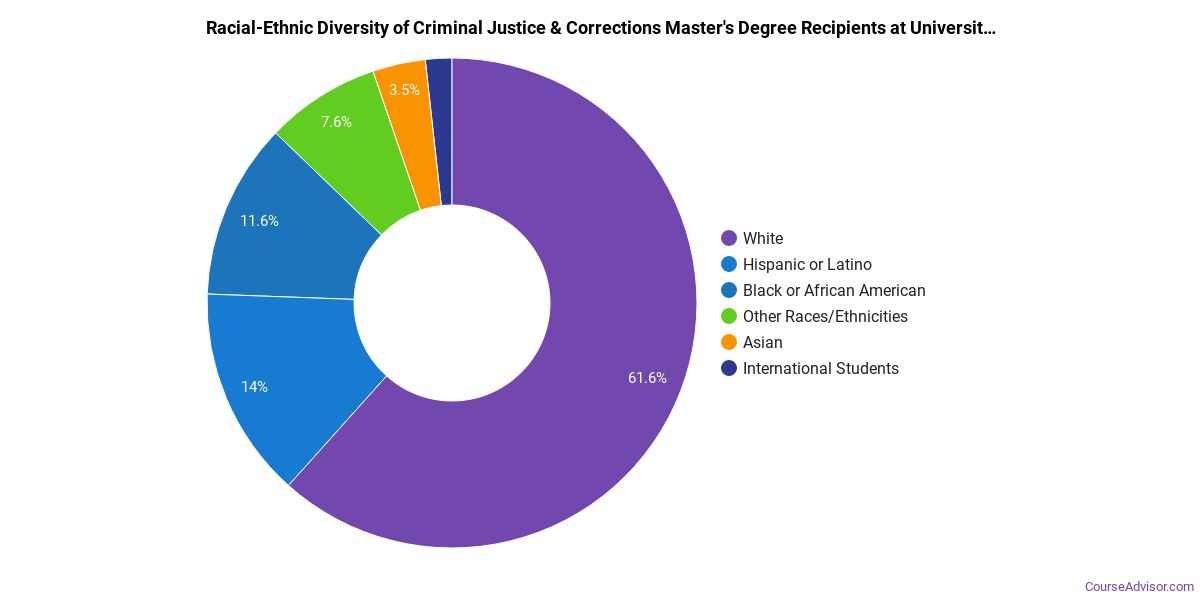
Minority students account for 33% of Criminal Justice & Corrections master’s degree recipients at University of New Haven, below the national average of 47%.*
Criminal Justice & Corrections Doctoral Program at University of New Haven
Of the 1 doctoral criminal justice & corrections graduates at University of New Haven, 100% were women (1) and 0% were men (0).

The following table and chart show the race/ethnicity of Criminal Justice & Corrections doctoral degree recipients at University of New Haven.
| Race / Ethnicity | Number of Graduates |
|---|---|
| White | 1 |

*The racial-ethnic minorities figure is the total number of graduates minus White, international (nonresident), and unknown-race graduates.
More Specific Criminal Justice & Corrections Concentrations at University of New Haven
The Criminal Justice & Corrections program at University of New Haven offers more specialized concentrations:
| Concentration | Graduates |
|---|---|
| Criminal Justice and Corrections. | 3 |
| Criminal Justice | 249 |
| Security & Loss Prevention Services | 39 |
| Criminal Investigation/Interviewing | 113 |
| Other Corrections & Criminal Justice | 5 |
Highest-Paying Careers for Criminal Justice & Corrections Graduates
Graduates of the Criminal Justice & Corrections program at University of New Haven go on to a range of careers. Below are the best-paid careers for Criminal Justice & Corrections majors, ordered by median annual salary:
| Occupation | Nationwide Median Wage |
|---|---|
| Wind Energy Development Managers | $169,952 |
| Loss Prevention Managers | $165,723 |
| Wind Energy Operations Managers | $122,567 |
| Environmental Compliance Inspectors | $119,630 |
| Compliance Managers | $117,178 |
| Coroners | $110,095 |
| Brownfield Redevelopment Specialists and Site Managers | $99,321 |
| Managers, All Other | $95,684 |
| Criminal Justice and Law Enforcement Teachers, Postsecondary | $91,449 |
| Regulatory Affairs Specialists | $85,399 |
References
- IPEDS — Integrated Postsecondary Education Data System
- U.S. Department of Education — College Scorecard
- O*NET Online (Bureau of Labor Statistics)
- National Center for Education Statistics
More about our data sources and methodologies.
Course Advisor provides higher-education, college and university, degree, program, career, salary, and other helpful information to students, faculty, institutions, and other internet audiences. Presented information and data are subject to change. Inclusion on this website does not imply or represent a direct relationship with the company, school, or brand. Information, though believed correct at time of publication, may not be correct, and no warranty is provided. Contact the schools to verify any information before relying on it. Financial aid may be available for those who qualify. The displayed options may include sponsored or recommended results, not necessarily based on your preferences.
© Course Advisor – All Rights Reserved.