Fine & Studio Arts at University of Massachusetts-Lowell
What traits are you looking for in a school for Fine & Studio Arts, you may want to check out the program at University of Massachusetts-Lowell. We’ve gathered the following information to help you decide.
University of Massachusetts-Lowell is located in Lowell, MA.
In the most recent year for which we have data, 23 fine & studio arts degrees were awarded at University of Massachusetts-Lowell.
Featured schools near , edit
Studying Online at University of Massachusetts-Lowell
Distance learning is available at University of Massachusetts-Lowell. Among 16,598 students, 5,089 (31%) studied exclusively online and 1,937 (12%) took at least some classes online.
Fine & Studio Arts Rankings at University of Massachusetts-Lowell
These rankings give you a sense of how University of Massachusetts-Lowell’s Fine & Studio Arts program to other colleges that offer this major.
Bachelor’s-Level Rankings
| Ranking | Scope | Rank |
|---|---|---|
| Best Schools (Quality) | Massachusetts | #9 of 26 |
| Best Value | Massachusetts | #11 of 26 |
| Best Value | New England (Region) | #17 of 56 |
| Best Schools (Quality) | New England (Region) | #18 of 56 |
| Best Schools (Quality) | Nationwide | #148 of 666 |
| Best Value | Nationwide | #421 of 662 |
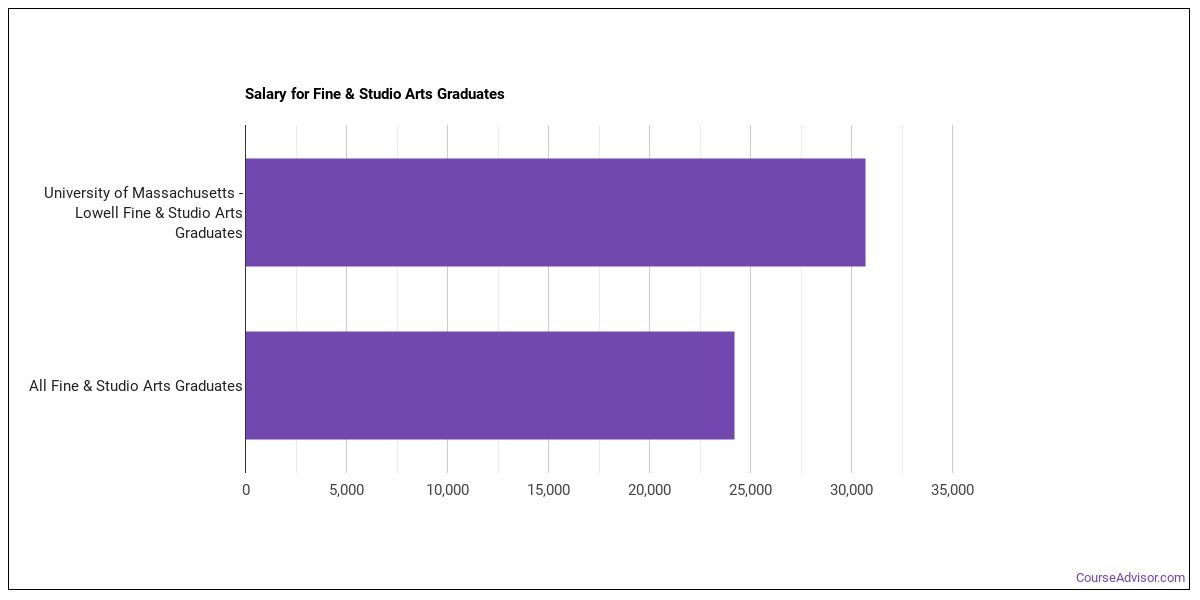
Earnings for Fine & Studio Arts Graduates from University of Massachusetts-Lowell
Students who complete University of Massachusetts-Lowell’s Fine & Studio Arts program earn the following amounts (per the U.S. Department of Education’s College Scorecard):
| Years After Graduation | Median Earnings |
|---|---|
| 1 year | $30,705 |
| 2 years | $31,851 |
| 3 years | $41,332 |
| 4 years | $49,153 |
| 5 years | $63,880 |
How do these earnings stack up against the rest of the school? Four years after graduating, Fine & Studio Arts graduates from University of Massachusetts-Lowell take home a median $49,153, compared with $77,628 for all University of Massachusetts-Lowell graduates — about 37% lower than the school-wide median.

Median Debt at Graduation
The median debt for Fine & Studio Arts graduates from University of Massachusetts-Lowell is $27,000.
Student Demographics & Diversity
Below you’ll find the composition of Fine & Studio Arts graduates at University of Massachusetts-Lowell, broken down by degree level.
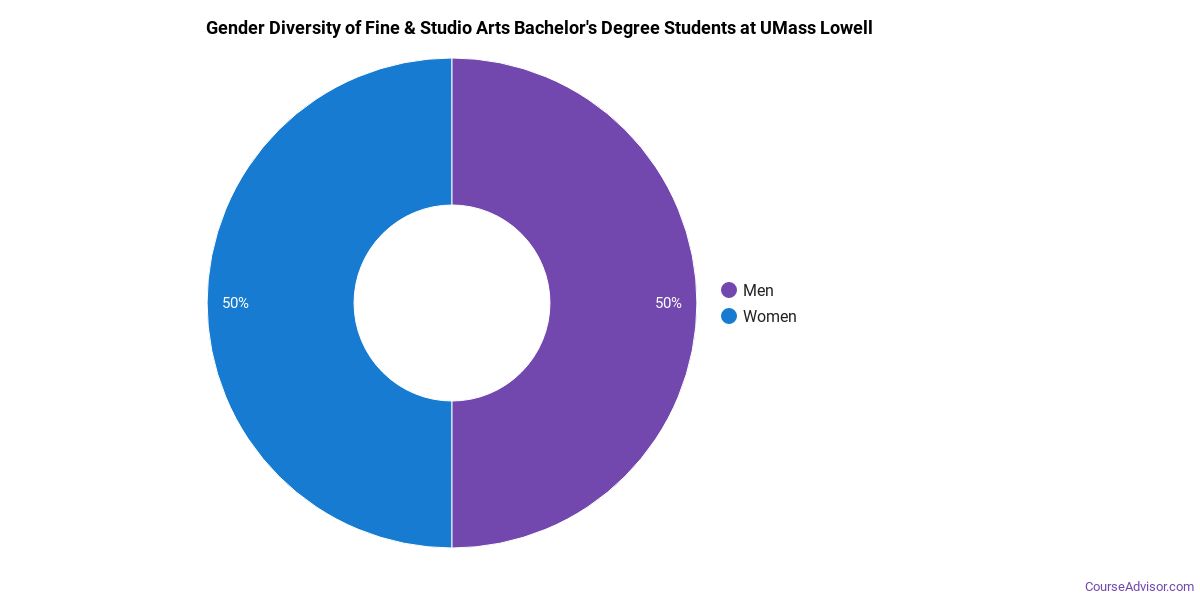
Looking at the program as a whole, Fine & Studio Arts graduates at University of Massachusetts-Lowell are 70% women (16) and 30% men (7).
Fine & Studio Arts Bachelor’s Program at University of Massachusetts-Lowell
Among the 23 bachelor’s fine & studio arts graduates at University of Massachusetts-Lowell, 70% were women (16) and 30% were men (7).
The following table and chart show the race/ethnicity of Fine & Studio Arts bachelor’s degree recipients at University of Massachusetts-Lowell.
| Race / Ethnicity | Number of Graduates |
|---|---|
| White | 14 |
| Hispanic / Latino | 3 |
| Black / African American | 1 |
| Asian | 1 |
| International (Nonresident) | 2 |
| Unknown | 2 |
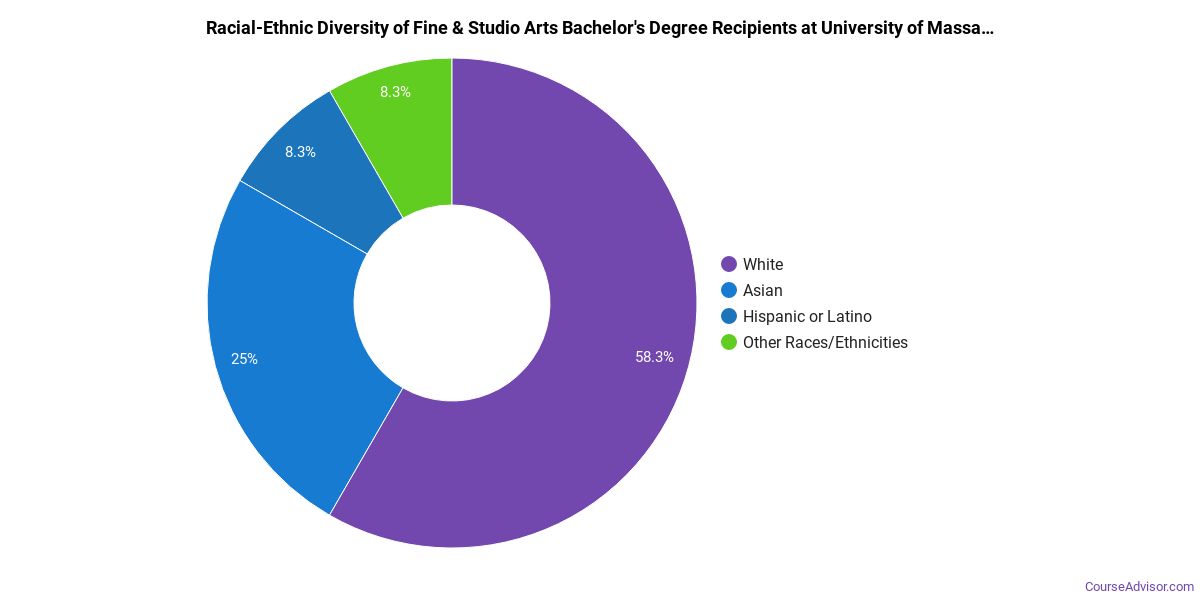
Racial-ethnic minorities make up 22% of Fine & Studio Arts bachelor’s degree recipients at University of Massachusetts-Lowell, lower than the national average of 40%.*
*The racial-ethnic minorities figure is the total number of graduates minus White, international (nonresident), and unknown-race graduates.
More Specific Fine & Studio Arts Concentrations at University of Massachusetts-Lowell
This Fine & Studio Arts program at University of Massachusetts-Lowell breaks down into more specific concentrations:
| Concentration | Graduates |
|---|---|
| Other Fine Arts & Art Studies | 23 |
Top-Paying Careers for Fine & Studio Arts Graduates
Students who finish Fine & Studio Arts program at University of Massachusetts-Lowell work across a variety of fields. Below are the best-paid careers for Fine & Studio Arts graduates, ordered by median annual salary:
| Occupation | Nationwide Median Wage |
|---|---|
| Appraisers of Personal and Business Property | $118,242 |
| Art Directors | $103,285 |
| Museum Technicians and Conservators | $96,273 |
| Artists and Related Workers, All Other | $83,610 |
| Curators | $79,764 |
| Secondary School Teachers, Except Special and Career/Technical Education | $77,927 |
| Craft Artists | $76,826 |
| Photographers | $75,743 |
| Fine Artists, Including Painters, Sculptors, and Illustrators | $69,338 |
| Jewelers and Precious Stone and Metal Workers | $67,147 |
References
- IPEDS — Integrated Postsecondary Education Data System
- U.S. Department of Education — College Scorecard
- O*NET Online (Bureau of Labor Statistics)
- National Center for Education Statistics
More about our data sources and methodologies.
Course Advisor provides higher-education, college and university, degree, program, career, salary, and other helpful information to students, faculty, institutions, and other internet audiences. Presented information and data are subject to change. Inclusion on this website does not imply or represent a direct relationship with the company, school, or brand. Information, though believed correct at time of publication, may not be correct, and no warranty is provided. Contact the schools to verify any information before relying on it. Financial aid may be available for those who qualify. The displayed options may include sponsored or recommended results, not necessarily based on your preferences.
© Course Advisor – All Rights Reserved.