Mechanical Engineering at University of Maryland-Baltimore County
If you plan to study Mechanical Engineering, you may want to check out the program at University of Maryland-Baltimore County. Get started with the following essential facts.
University of Maryland-Baltimore County is located in Baltimore, MD.
In the most recent year for which we have data, 144 mechanical engineering graduations were recorded at University of Maryland-Baltimore County.
Featured schools near , edit
Studying Online at University of Maryland-Baltimore County
Online coursework is an option at University of Maryland-Baltimore County. Of 13,906 students, 580 (4%) studied exclusively online and 8,081 (58%) took at least some classes online.
Mechanical Engineering Rankings at University of Maryland-Baltimore County
Use these rankings to compare University of Maryland-Baltimore County’s Mechanical Engineering program against peer institutions.
Bachelor’s-Level Rankings
| Ranking | Scope | Rank |
|---|---|---|
| Best Schools (Quality) | Maryland | #3 of 3 |
| Best Value | Maryland | #3 of 3 |
| Best Value | Middle Atlantic (Region) | #8 of 61 |
| Best Schools (Quality) | Middle Atlantic (Region) | #21 of 61 |
| Best Schools (Quality) | Nationwide | #89 of 365 |
| Best Value | Nationwide | #184 of 364 |
Master’s-Level Rankings
| Ranking | Scope | Rank |
|---|---|---|
| Best Schools (Quality) | Maryland | #3 of 3 |
| Best Value | Maryland | #3 of 3 |
| Best Value | Middle Atlantic (Region) | #8 of 61 |
| Best Schools (Quality) | Middle Atlantic (Region) | #21 of 61 |
| Best Schools (Quality) | Nationwide | #89 of 365 |
| Best Value | Nationwide | #184 of 364 |
Doctoral-Level Rankings
| Ranking | Scope | Rank |
|---|---|---|
| Best Schools (Quality) | Maryland | #3 of 3 |
| Best Value | Maryland | #3 of 3 |
| Best Value | Middle Atlantic (Region) | #8 of 61 |
| Best Schools (Quality) | Middle Atlantic (Region) | #21 of 61 |
| Best Schools (Quality) | Nationwide | #89 of 365 |
| Best Value | Nationwide | #184 of 364 |
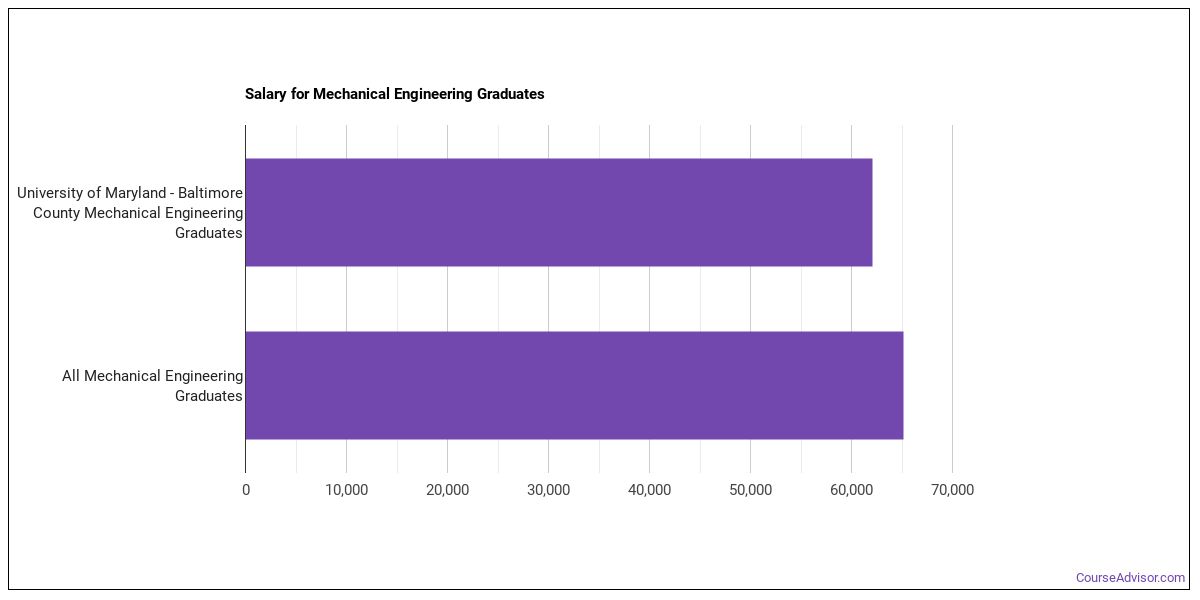
Earnings for Mechanical Engineering Graduates from University of Maryland-Baltimore County
Students who complete University of Maryland-Baltimore County’s Mechanical Engineering program report the following median earnings (per the U.S. Department of Education’s College Scorecard):
| Years After Graduation | Median Earnings |
|---|---|
| 1 year | $62,037 |
| 2 years | $60,240 |
| 3 years | $71,621 |
| 4 years | $82,502 |
| 5 years | $93,344 |
How do these earnings stack up against the rest of the school? At the four-year mark, Mechanical Engineering graduates from University of Maryland-Baltimore County report median earnings of $82,502, compared with $76,447 for all University of Maryland-Baltimore County graduates — about 8% higher than the school-wide median.

Median Debt at Graduation
Typical debt at graduation for Mechanical Engineering graduates from University of Maryland-Baltimore County comes in at $21,500.
Student Demographics & Diversity
Take a look at the diversity of Mechanical Engineering graduates at University of Maryland-Baltimore County, broken down by degree level.
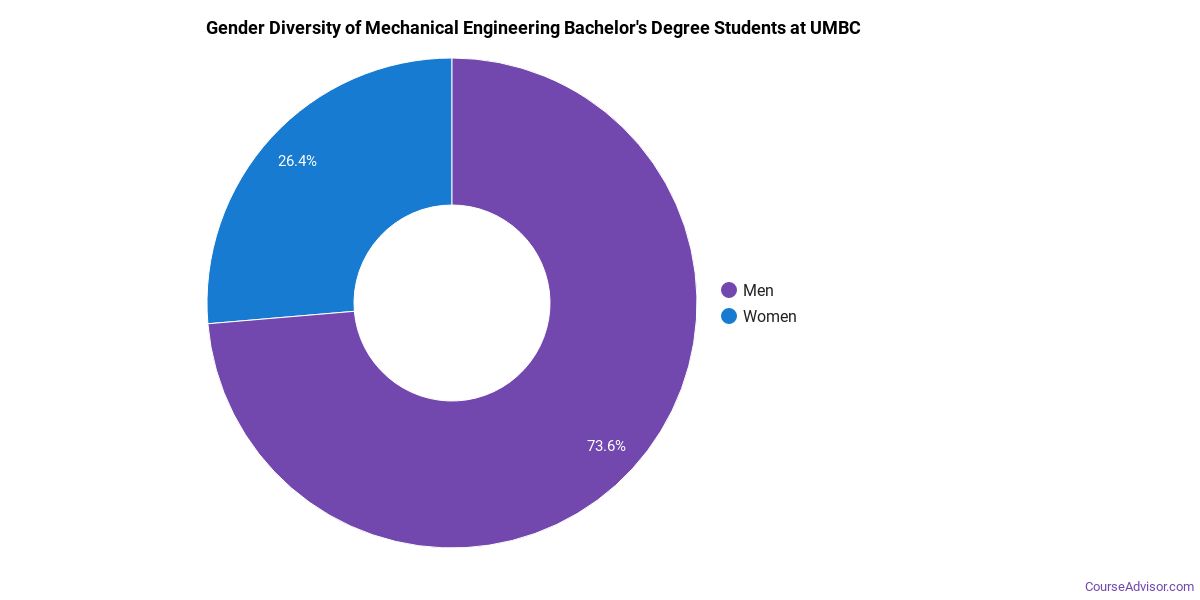
Looking at the program as a whole, Mechanical Engineering graduates at University of Maryland-Baltimore County are 15% women (22) and 85% men (122).
Mechanical Engineering Bachelor’s Program at University of Maryland-Baltimore County
Of the 123 bachelor’s mechanical engineering degrees awarded at University of Maryland-Baltimore County, 15% were women (18) and 85% were men (105).
The following table and chart show the race/ethnicity of Mechanical Engineering bachelor’s degree recipients at University of Maryland-Baltimore County.
| Race / Ethnicity | Number of Graduates |
|---|---|
| White | 70 |
| Hispanic / Latino | 3 |
| Black / African American | 28 |
| Asian | 14 |
| Two or More Races | 1 |
| International (Nonresident) | 5 |
| Unknown | 2 |
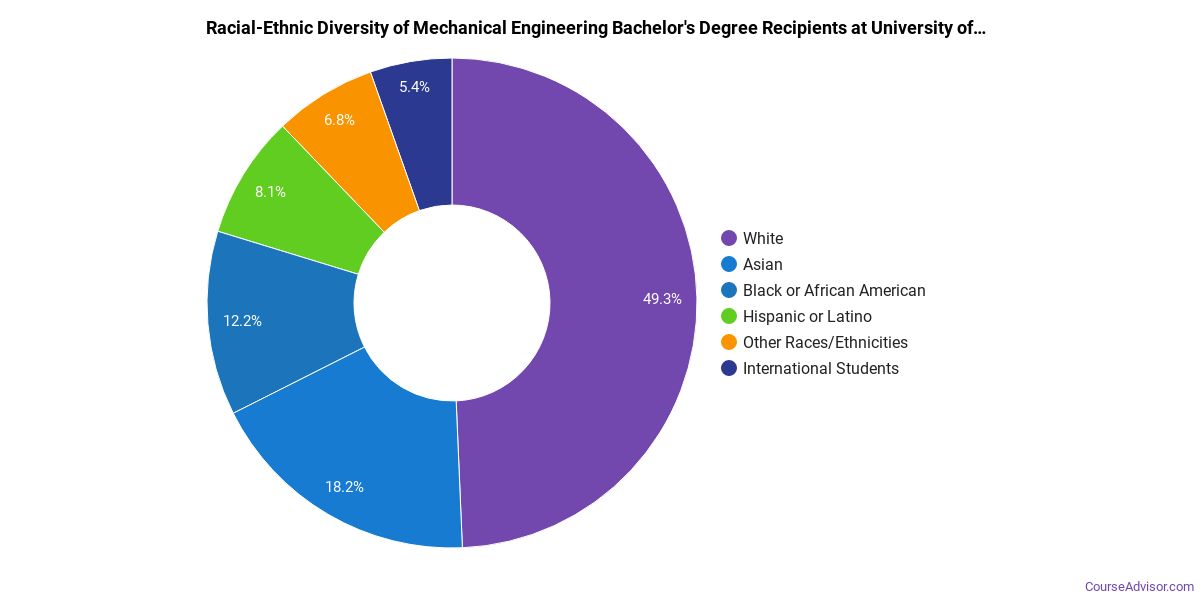
Racial-ethnic minorities make up 37% of Mechanical Engineering bachelor’s degree recipients at University of Maryland-Baltimore County, higher than the national average of 34%.*
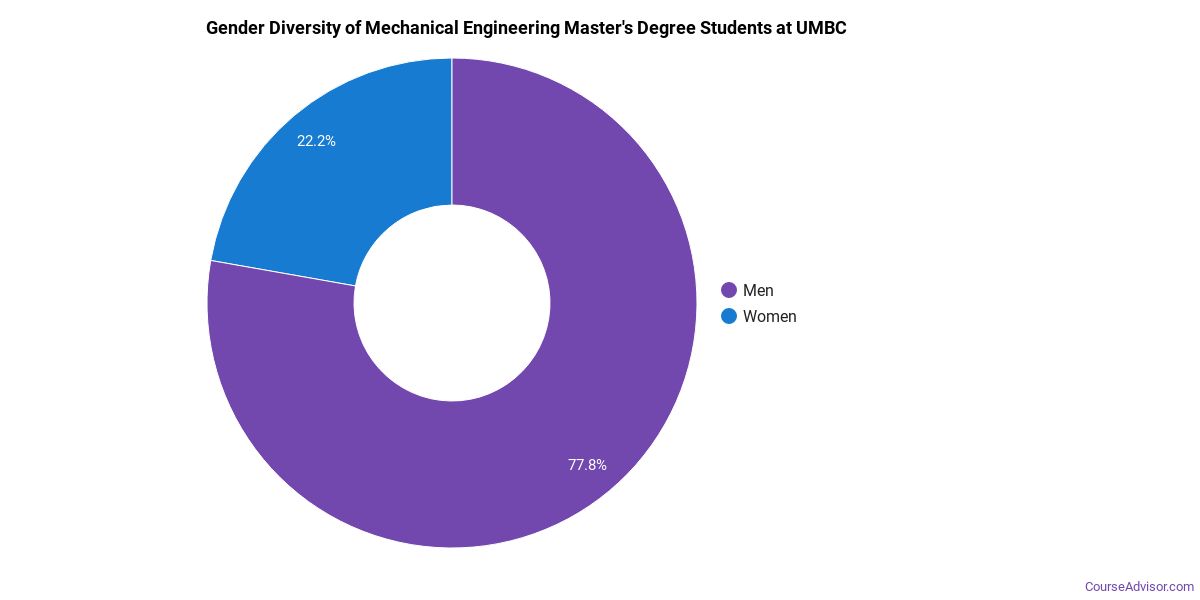
Mechanical Engineering Master’s Program at University of Maryland-Baltimore County
Of the 13 master’s mechanical engineering graduates at University of Maryland-Baltimore County, 15% were women (2) and 85% were men (11).
The following table and chart show the race/ethnicity of Mechanical Engineering master’s degree recipients at University of Maryland-Baltimore County.
| Race / Ethnicity | Number of Graduates |
|---|---|
| White | 3 |
| Hispanic / Latino | 1 |
| Black / African American | 1 |
| Asian | 3 |
| International (Nonresident) | 5 |
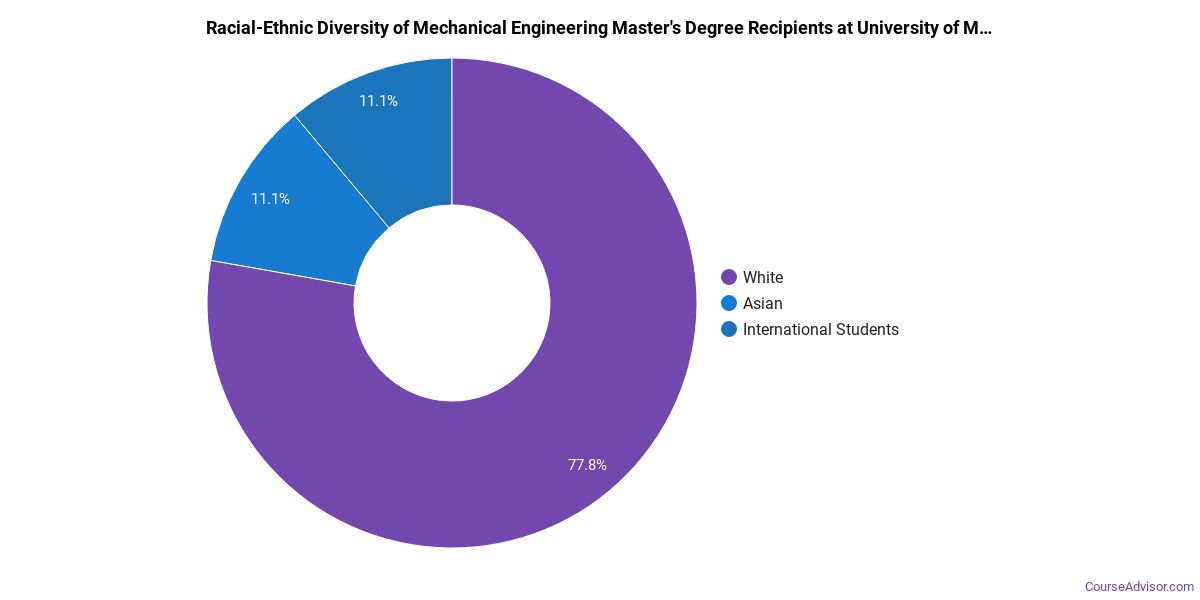
Minority students account for 38% of Mechanical Engineering master’s degree recipients at University of Maryland-Baltimore County, above the national average of 23%.*
Mechanical Engineering Doctoral Program at University of Maryland-Baltimore County
Of the 4 doctoral mechanical engineering graduates at University of Maryland-Baltimore County, 25% were women (1) and 75% were men (3).

The following table and chart show the race/ethnicity of Mechanical Engineering doctoral degree recipients at University of Maryland-Baltimore County.
| Race / Ethnicity | Number of Graduates |
|---|---|
| Hispanic / Latino | 1 |
| International (Nonresident) | 3 |

Racial-ethnic minorities make up 25% of Mechanical Engineering doctoral degree recipients at University of Maryland-Baltimore County, higher than the national average of 13%.*
*The racial-ethnic minorities figure is the total number of graduates minus White, international (nonresident), and unknown-race graduates.
More Specific Mechanical Engineering Concentrations at University of Maryland-Baltimore County
The Mechanical Engineering program at University of Maryland-Baltimore County offers more specialized concentrations:
| Concentration | Graduates |
|---|---|
| General Mechanical Engineering | 144 |
Top-Paying Careers for Mechanical Engineering Graduates
Graduates of the Mechanical Engineering program at University of Maryland-Baltimore County go on to a range of careers. Here are the highest-paying careers for Mechanical Engineering graduates, ordered by median annual salary:
| Occupation | Nationwide Median Wage |
|---|---|
| Fuel Cell Engineers | $137,020 |
| Automotive Engineers | $107,733 |
| Architectural and Engineering Managers | $101,277 |
| Biofuels/Biodiesel Technology and Product Development Managers | $89,263 |
| Cost Estimators | $80,966 |
| Engineering Teachers, Postsecondary | $79,889 |
| Mechanical Engineers | $79,543 |
| Aerospace Engineers | $63,328 |
References
- IPEDS — Integrated Postsecondary Education Data System
- U.S. Department of Education — College Scorecard
- O*NET Online (Bureau of Labor Statistics)
- National Center for Education Statistics
More about our data sources and methodologies.
Course Advisor provides higher-education, college and university, degree, program, career, salary, and other helpful information to students, faculty, institutions, and other internet audiences. Presented information and data are subject to change. Inclusion on this website does not imply or represent a direct relationship with the company, school, or brand. Information, though believed correct at time of publication, may not be correct, and no warranty is provided. Contact the schools to verify any information before relying on it. Financial aid may be available for those who qualify. The displayed options may include sponsored or recommended results, not necessarily based on your preferences.
© Course Advisor – All Rights Reserved.