Chemistry at University of Louisville
If you are interested in studying Chemistry, consider the program at University of Louisville. Get started with the following essential facts.
University of Louisville is in Louisville, KY.
During the most recent reporting year, 54 chemistry degrees were granted at University of Louisville.
Featured schools near , edit
Online Class Availability at University of Louisville
Many students take online classes at University of Louisville. Of 23,065 students, 4,555 (20%) were enrolled entirely in distance education and 9,040 (39%) took at least some classes online.
Median Debt at Graduation
The median debt for Chemistry graduates from University of Louisville stands at $24,411.
Student Demographics & Diversity
The following sections describe the diversity of Chemistry graduates at University of Louisville, broken down by degree level.
Across all degree levels, Chemistry graduates at University of Louisville are 44% women (24) and 56% men (30).
Chemistry Bachelor’s Program at University of Louisville
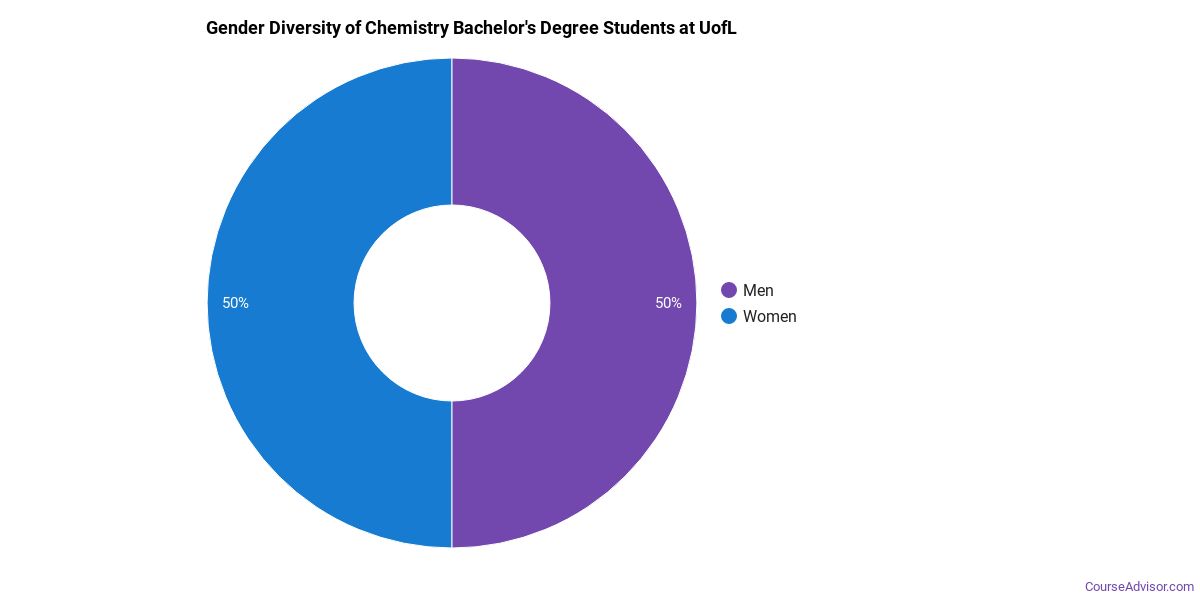
Among the 24 bachelor’s chemistry graduates at University of Louisville, 54% were women (13) and 46% were men (11).
The following table and chart show the race/ethnicity of Chemistry bachelor’s degree recipients at University of Louisville.
| Race / Ethnicity | Number of Graduates |
|---|---|
| White | 17 |
| Hispanic / Latino | 2 |
| Black / African American | 1 |
| Asian | 4 |
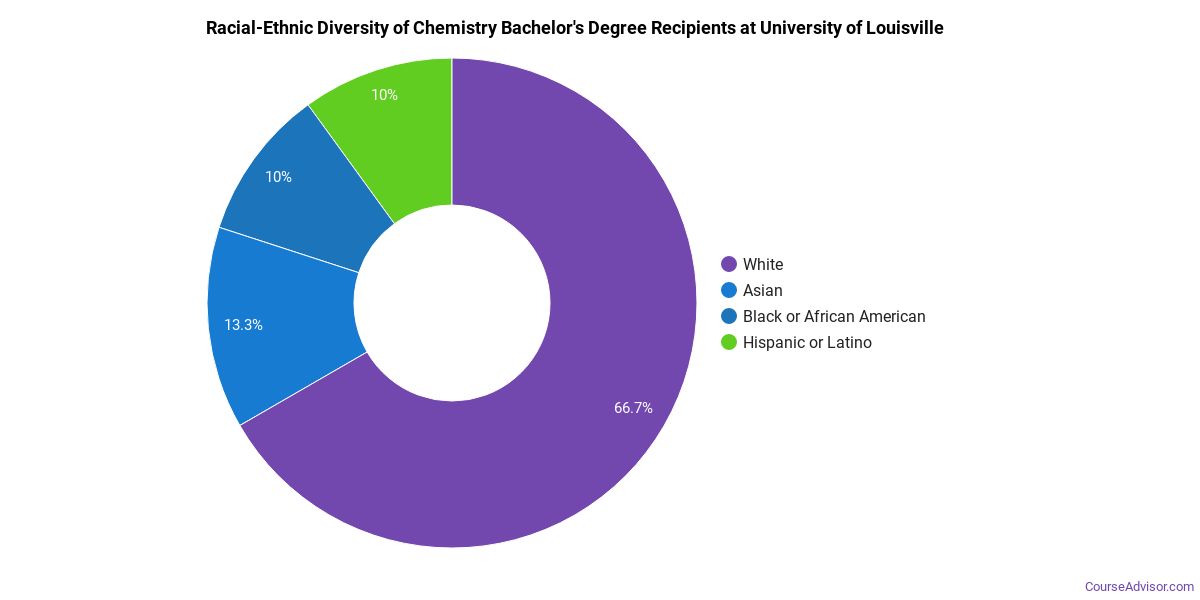
Minority students account for 29% of Chemistry bachelor’s degree recipients at University of Louisville, lower than the national average of 40%.*
Chemistry Master’s Program at University of Louisville
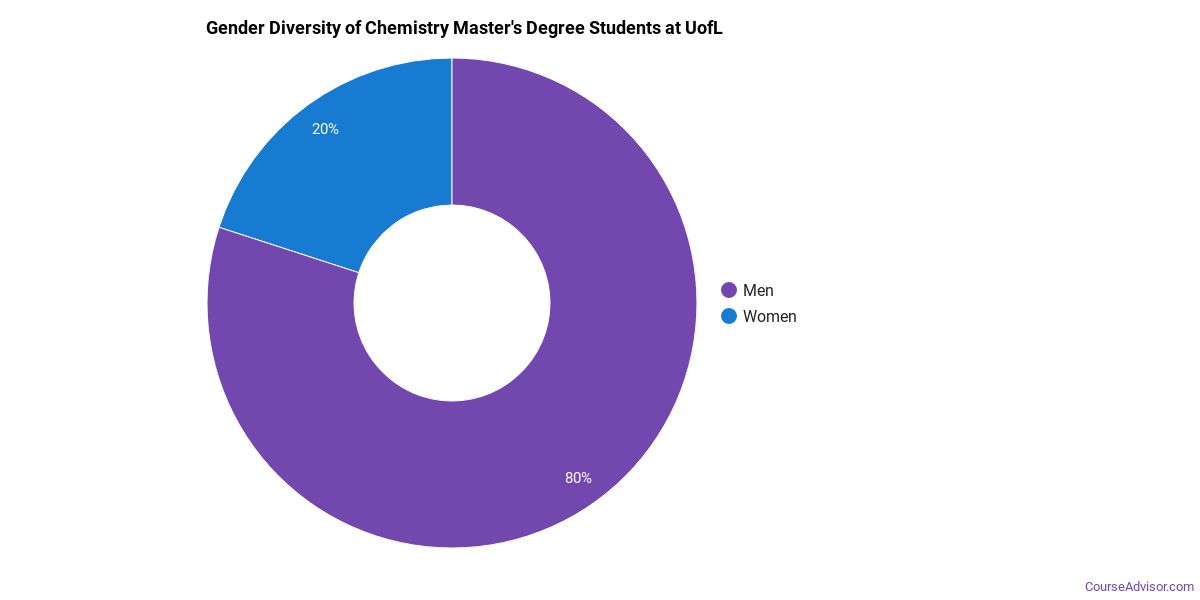
Of the 16 master’s chemistry graduates at University of Louisville, 38% were women (6) and 62% were men (10).
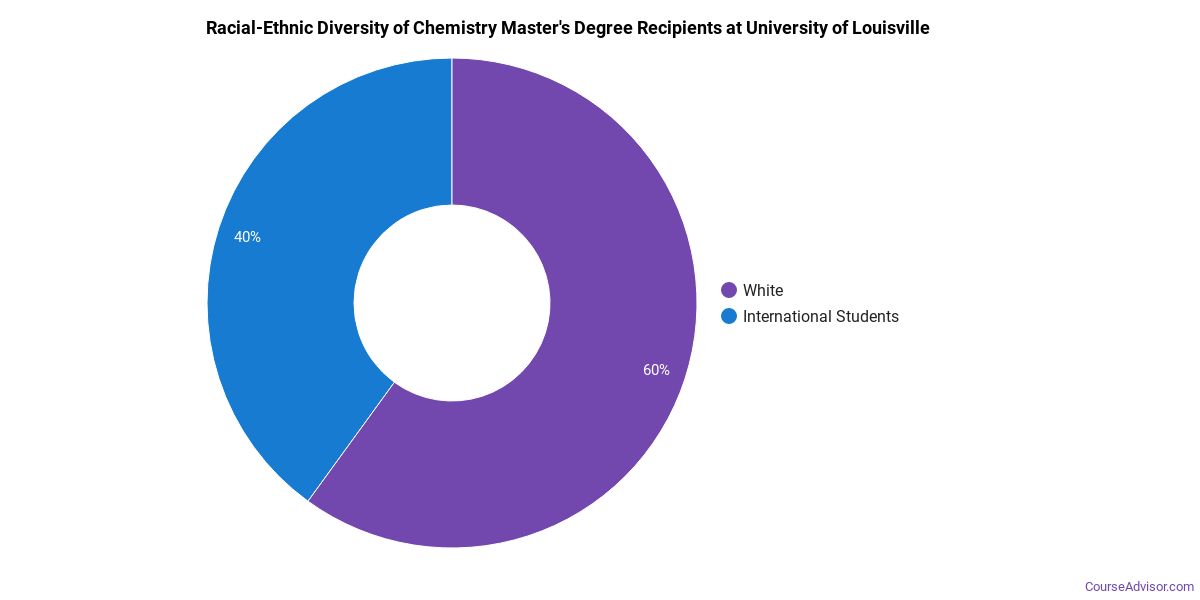
The following table and chart show the race/ethnicity of Chemistry master’s degree recipients at University of Louisville.
| Race / Ethnicity | Number of Graduates |
|---|---|
| White | 1 |
| International (Nonresident) | 15 |
Chemistry Doctoral Program at University of Louisville
Of the 14 doctoral chemistry degrees awarded at University of Louisville, 36% were women (5) and 64% were men (9).

The following table and chart show the race/ethnicity of Chemistry doctoral degree recipients at University of Louisville.
| Race / Ethnicity | Number of Graduates |
|---|---|
| White | 2 |
| International (Nonresident) | 12 |

*The racial-ethnic minorities figure is the total number of graduates minus White, international (nonresident), and unknown-race graduates.
More Specific Chemistry Concentrations at University of Louisville
This Chemistry program at University of Louisville breaks down into more specific concentrations:
| Concentration | Graduates |
|---|---|
| General Chemistry | 54 |
Highest-Paying Careers for Chemistry Graduates
Those who complete Chemistry program at University of Louisville pursue many career paths. The table below ranks the best-paid careers for Chemistry graduates, ordered by median annual salary:
| Occupation | Nationwide Median Wage |
|---|---|
| Water Resource Specialists | $179,716 |
| Computer Occupations, All Other | $159,837 |
| Document Management Specialists | $147,490 |
| Business Intelligence Analysts | $143,840 |
| Information Security Engineers | $142,543 |
| Computer Systems Engineers/Architects | $140,795 |
| Natural Sciences Managers | $132,227 |
| Information Technology Project Managers | $124,655 |
| Blockchain Engineers | $123,667 |
| Digital Forensics Analysts | $119,226 |
References
- IPEDS — Integrated Postsecondary Education Data System
- U.S. Department of Education — College Scorecard
- O*NET Online (Bureau of Labor Statistics)
- National Center for Education Statistics
More about our data sources and methodologies.
Course Advisor provides higher-education, college and university, degree, program, career, salary, and other helpful information to students, faculty, institutions, and other internet audiences. Presented information and data are subject to change. Inclusion on this website does not imply or represent a direct relationship with the company, school, or brand. Information, though believed correct at time of publication, may not be correct, and no warranty is provided. Contact the schools to verify any information before relying on it. Financial aid may be available for those who qualify. The displayed options may include sponsored or recommended results, not necessarily based on your preferences.
© Course Advisor – All Rights Reserved.