Criminal Justice & Corrections at University of Cincinnati-Main Campus
What traits are you looking for in a school for Criminal Justice & Corrections, take a look at what University of Cincinnati-Main Campus. Get started with the following essential facts.
University of Cincinnati-Main Campus is located in Cincinnati, OH.
For the most recent IPEDS reporting year, 325 criminal justice & corrections graduations were recorded at University of Cincinnati-Main Campus.
Featured schools near , edit
Studying Online at University of Cincinnati-Main Campus
Online coursework is an option at University of Cincinnati-Main Campus. Of 45,026 students, 9,022 (20%) were enrolled entirely in distance education and 19,145 (43%) took at least some classes online.
Criminal Justice & Corrections Rankings at University of Cincinnati-Main Campus
These rankings give you a sense of how University of Cincinnati-Main Campus’s Criminal Justice & Corrections program against other schools offering the same major.
Bachelor’s-Level Rankings
| Ranking | Scope | Rank |
|---|---|---|
| Best Schools (Quality) | Ohio | #5 of 49 |
| Best Schools (Quality) | Great Lakes (Region) | #29 of 167 |
| Best Value | Ohio | #41 of 48 |
| Best Schools (Quality) | Nationwide | #134 of 1,205 |
| Best Value | Great Lakes (Region) | #149 of 166 |
| Best Value | Nationwide | #1027 of 1,206 |
Master’s-Level Rankings
| Ranking | Scope | Rank |
|---|---|---|
| Best Schools (Quality) | Ohio | #5 of 49 |
| Best Schools (Quality) | Great Lakes (Region) | #29 of 167 |
| Best Value | Ohio | #41 of 48 |
| Best Schools (Quality) | Nationwide | #134 of 1,205 |
| Best Value | Great Lakes (Region) | #149 of 166 |
| Best Value | Nationwide | #1027 of 1,206 |
Doctoral-Level Rankings
| Ranking | Scope | Rank |
|---|---|---|
| Best Schools (Quality) | Ohio | #5 of 49 |
| Best Schools (Quality) | Great Lakes (Region) | #29 of 167 |
| Best Value | Ohio | #41 of 48 |
| Best Schools (Quality) | Nationwide | #134 of 1,205 |
| Best Value | Great Lakes (Region) | #149 of 166 |
| Best Value | Nationwide | #1027 of 1,206 |
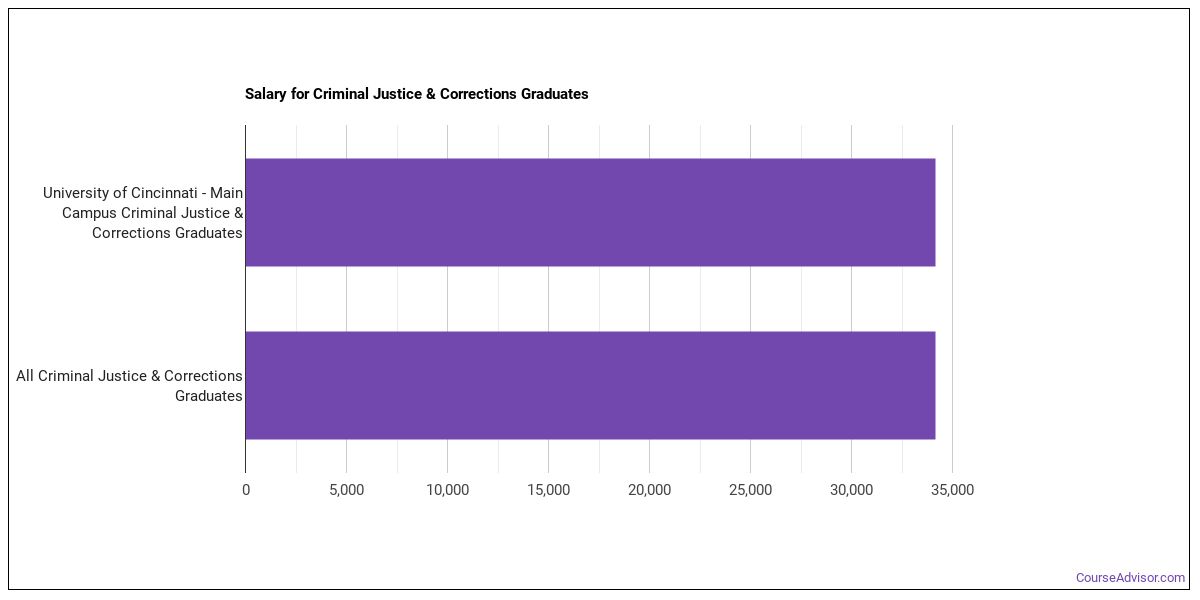
Earnings for Criminal Justice & Corrections Graduates from University of Cincinnati-Main Campus
Those who finish University of Cincinnati-Main Campus’s Criminal Justice & Corrections program earn the following amounts (per the U.S. Department of Education’s College Scorecard):
| Years After Graduation | Median Earnings |
|---|---|
| 1 year | $37,461 |
| 2 years | $37,757 |
| 3 years | $45,222 |
| 4 years | $51,329 |
| 5 years | $57,007 |
How do these earnings stack up against the rest of the school? At the four-year mark, Criminal Justice & Corrections graduates from University of Cincinnati-Main Campus take home a median $51,329, compared with $66,139 for all University of Cincinnati-Main Campus graduates — about 22% lower than the school-wide median.

Median Debt at Graduation
The median debt for Criminal Justice & Corrections graduates from University of Cincinnati-Main Campus stands at $21,253.
Student Demographics & Diversity
Take a look at the student demographics for Criminal Justice & Corrections graduates at University of Cincinnati-Main Campus, broken down by degree level.
Program-wide, Criminal Justice & Corrections graduates at University of Cincinnati-Main Campus are 67% women (217) and 33% men (108).
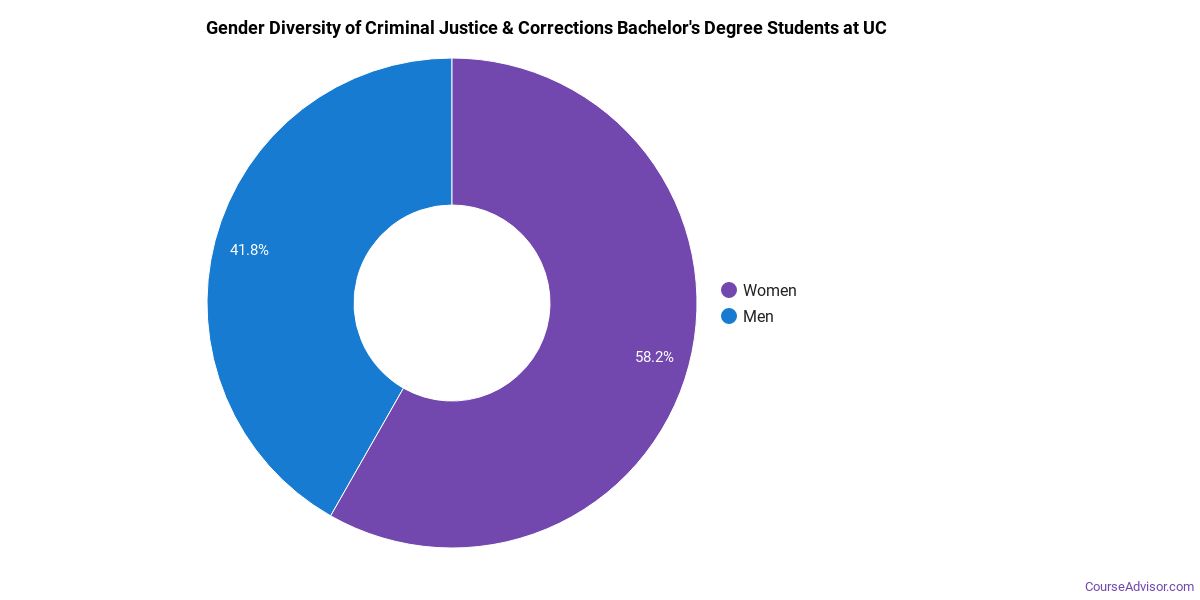
Criminal Justice & Corrections Bachelor’s Program at University of Cincinnati-Main Campus
Among the 188 bachelor’s criminal justice & corrections graduates at University of Cincinnati-Main Campus, 68% were women (128) and 32% were men (60).
The following table and chart show the race/ethnicity of Criminal Justice & Corrections bachelor’s degree recipients at University of Cincinnati-Main Campus.
| Race / Ethnicity | Number of Graduates |
|---|---|
| White | 142 |
| Hispanic / Latino | 11 |
| Black / African American | 18 |
| Asian | 3 |
| American Indian / Alaska Native | 1 |
| Two or More Races | 7 |
| Unknown | 6 |
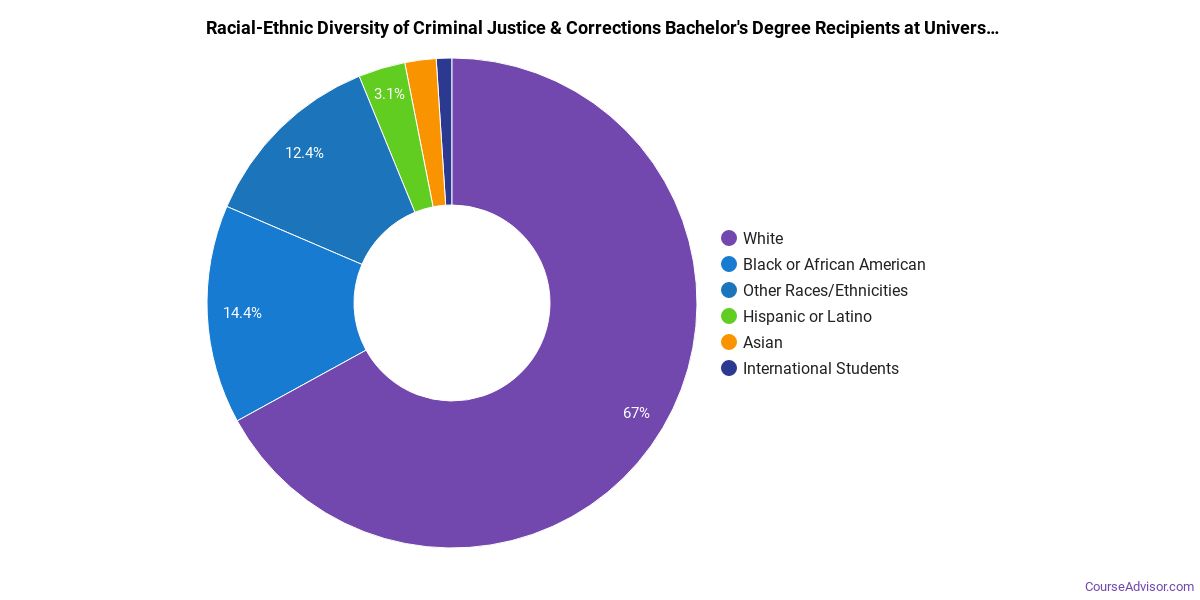
Racial-ethnic minorities make up 21% of Criminal Justice & Corrections bachelor’s degree recipients at University of Cincinnati-Main Campus, lower than the national average of 52%.*
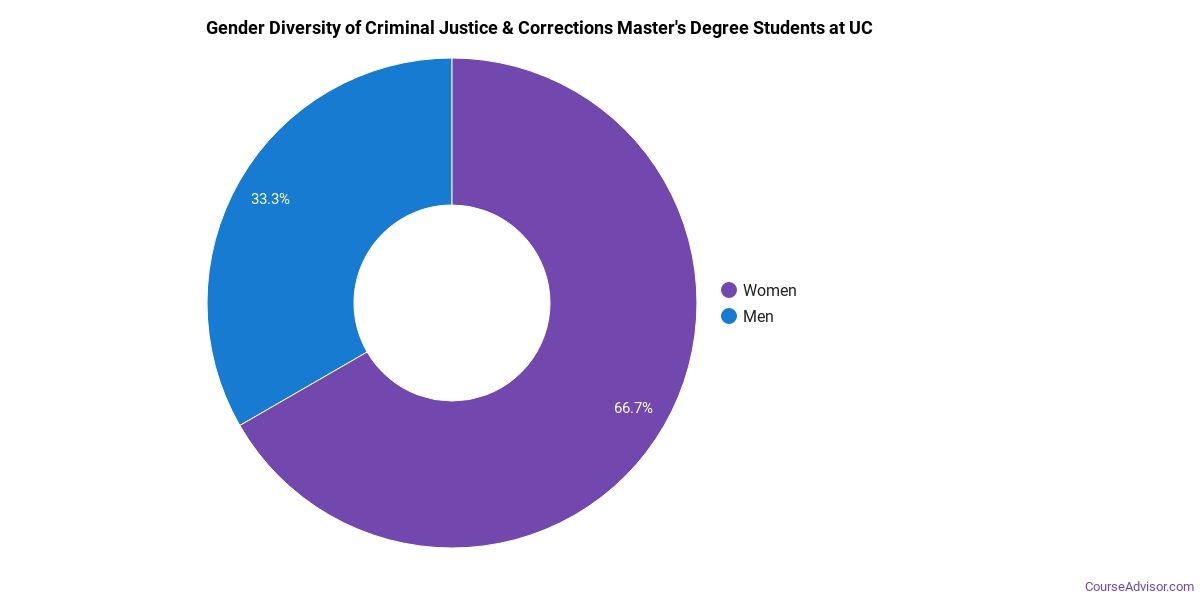
Criminal Justice & Corrections Master’s Program at University of Cincinnati-Main Campus
Of the 86 master’s criminal justice & corrections graduates at University of Cincinnati-Main Campus, 60% were women (52) and 40% were men (34).
The following table and chart show the race/ethnicity of Criminal Justice & Corrections master’s degree recipients at University of Cincinnati-Main Campus.
| Race / Ethnicity | Number of Graduates |
|---|---|
| White | 62 |
| Hispanic / Latino | 7 |
| Black / African American | 6 |
| Asian | 2 |
| Two or More Races | 5 |
| International (Nonresident) | 3 |
| Unknown | 1 |
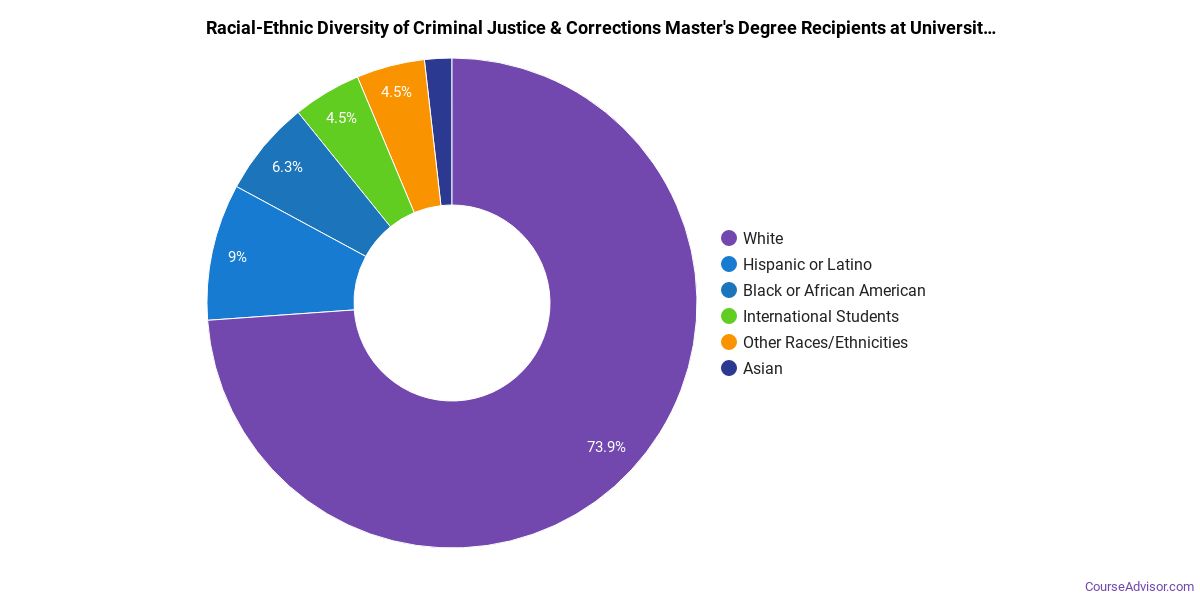
Minority students account for 23% of Criminal Justice & Corrections master’s degree recipients at University of Cincinnati-Main Campus, lower than the national average of 47%.*
Criminal Justice & Corrections Doctoral Program at University of Cincinnati-Main Campus
Of the 19 doctoral criminal justice & corrections degrees awarded at University of Cincinnati-Main Campus, 74% were women (14) and 26% were men (5).

The following table and chart show the race/ethnicity of Criminal Justice & Corrections doctoral degree recipients at University of Cincinnati-Main Campus.
| Race / Ethnicity | Number of Graduates |
|---|---|
| White | 12 |
| Hispanic / Latino | 2 |
| Black / African American | 2 |
| Asian | 1 |
| International (Nonresident) | 2 |

Minority students account for 26% of Criminal Justice & Corrections doctoral degree recipients at University of Cincinnati-Main Campus, lower than the national average of 34%.*
*The racial-ethnic minorities figure is the total number of graduates minus White, international (nonresident), and unknown-race graduates.
More Specific Criminal Justice & Corrections Concentrations at University of Cincinnati-Main Campus
The Criminal Justice & Corrections program at University of Cincinnati-Main Campus breaks down into more specific concentrations:
| Concentration | Graduates |
|---|---|
| Corrections | 1 |
| Criminal Justice Studies | 293 |
| Criminal Justice & Police Science | 2 |
| Corrections Administration | 7 |
| Other Corrections & Criminal Justice | 22 |
Best-Paid Careers for Criminal Justice & Corrections Graduates
Graduates of the Criminal Justice & Corrections program at University of Cincinnati-Main Campus go on to a range of careers. The table below ranks the best-paid careers for Criminal Justice & Corrections graduates, ordered by median annual salary:
| Occupation | Nationwide Median Wage |
|---|---|
| Wind Energy Development Managers | $169,952 |
| Loss Prevention Managers | $165,723 |
| Wind Energy Operations Managers | $122,567 |
| Environmental Compliance Inspectors | $119,630 |
| Compliance Managers | $117,178 |
| Coroners | $110,095 |
| Brownfield Redevelopment Specialists and Site Managers | $99,321 |
| Managers, All Other | $95,684 |
| Criminal Justice and Law Enforcement Teachers, Postsecondary | $91,449 |
| Regulatory Affairs Specialists | $85,399 |
References
- IPEDS — Integrated Postsecondary Education Data System
- U.S. Department of Education — College Scorecard
- O*NET Online (Bureau of Labor Statistics)
- National Center for Education Statistics
More about our data sources and methodologies.
Course Advisor provides higher-education, college and university, degree, program, career, salary, and other helpful information to students, faculty, institutions, and other internet audiences. Presented information and data are subject to change. Inclusion on this website does not imply or represent a direct relationship with the company, school, or brand. Information, though believed correct at time of publication, may not be correct, and no warranty is provided. Contact the schools to verify any information before relying on it. Financial aid may be available for those who qualify. The displayed options may include sponsored or recommended results, not necessarily based on your preferences.
© Course Advisor – All Rights Reserved.