Engineering at University of Cincinnati - Main Campus
UC is located in Cincinnati, Ohio and has a total student population of 40,826.
Want to know more about the career opportunities in this field? Check out the Careers in Engineering section at the bottom of this page.
UC Engineering Degrees Available
- Basic Certificate in Engineering (Less Than 1 Year)
- Bachelor’s Degree in Engineering
- Master’s Degree in Engineering
Online Classes Are Available at UC
Online courses are a good option for students who need a more flexible schedule that allows them to pursue an education when and where they want. Whether you're going to school part-time or full-time, you may find distance education the right choice for you.
UC does offer online education options in engineering for the following degree levels for those interested in distance learning:
- Master’s Degree
UC Engineering Rankings
The engineering major at UC is not ranked on College Factual’s Best Colleges and Universities for Engineering. This could be for a number of reasons, such as not having enough data on the major or school to make an accurate assessment of its quality.
There were 57 students who received their doctoral degrees in engineering. This makes the school the #64 most popular school in the United States for this category of students.
Engineering Student Demographics at UC
Take a look at the following statistics related to the make-up of the engineering majors at University of Cincinnati - Main Campus.
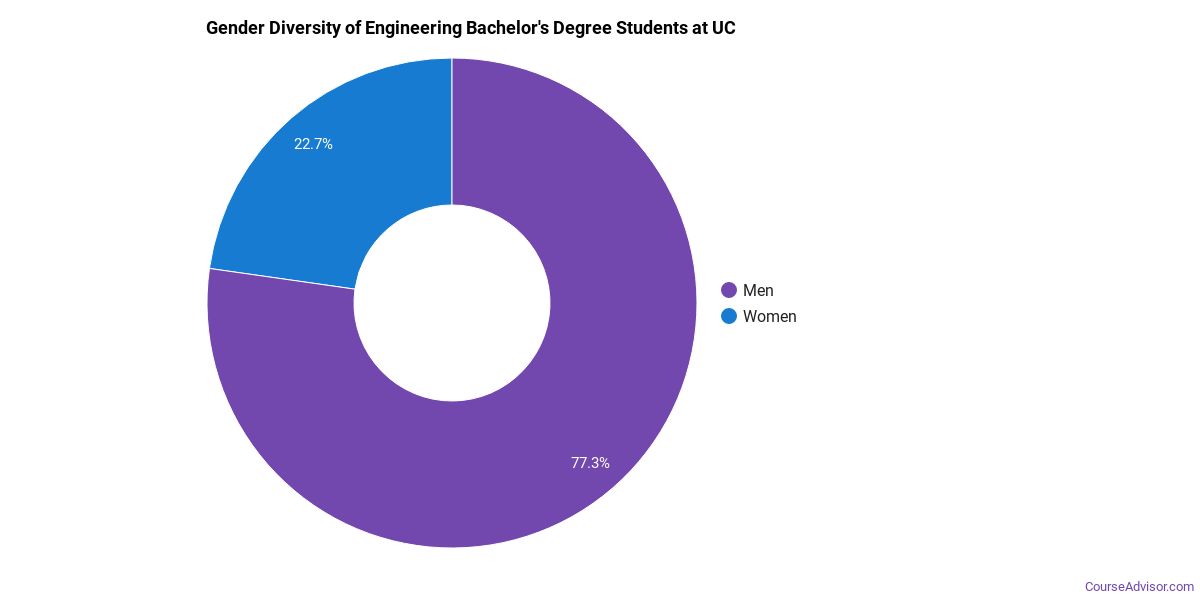
UC Engineering Bachelor’s Program
About 77% of those who receive a bachelor's degree in engineering at UC are white. This is above average for this degree on the nationwide level.
The following table and chart show the race/ethnicity for students who recently graduated from University of Cincinnati - Main Campus with a bachelor's in engineering.
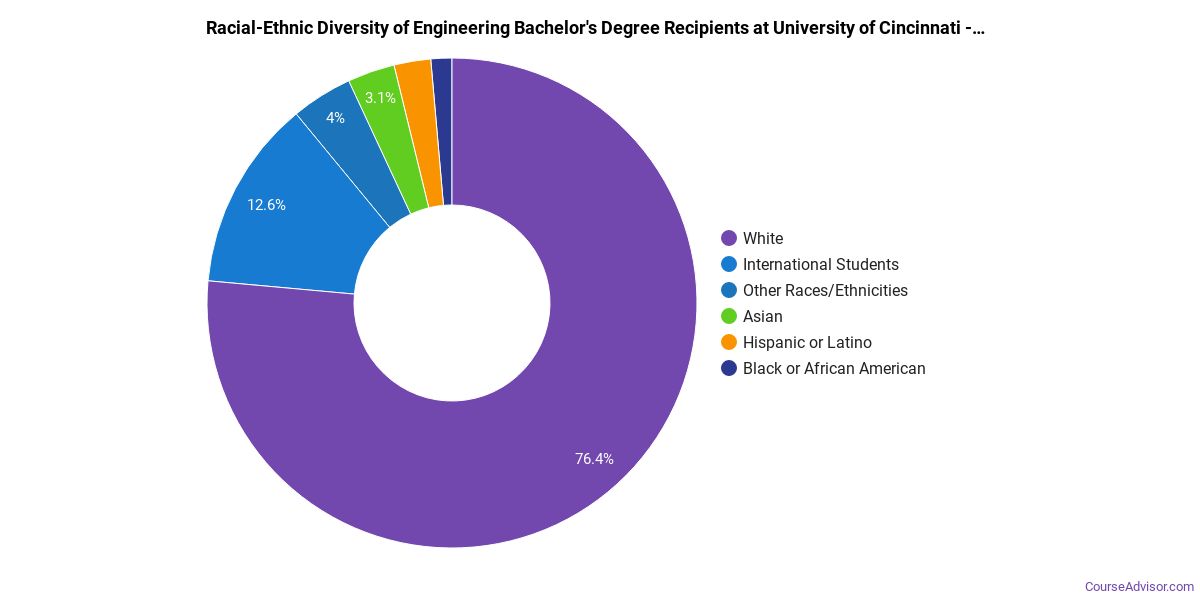
| Race/Ethnicity | Number of Students |
|---|---|
| Asian | 34 |
| Black or African American | 22 |
| Hispanic or Latino | 23 |
| White | 625 |
| International Students | 78 |
| Other Races/Ethnicities | 31 |
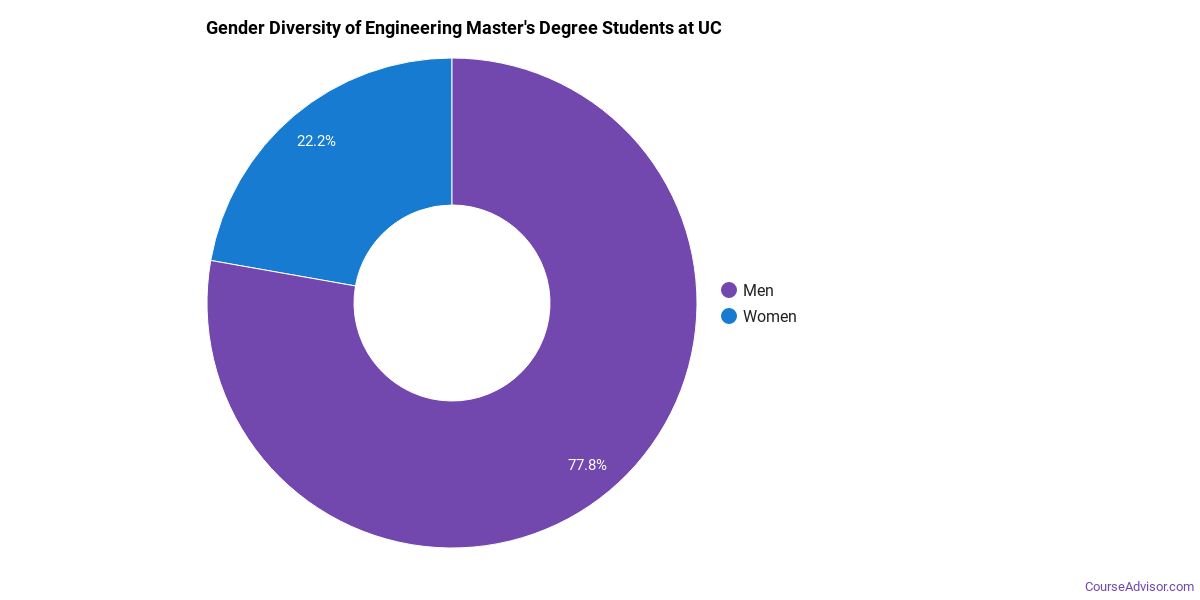
UC Engineering Master’s Program
The following table and chart show the race/ethnicity for students who recently graduated from University of Cincinnati - Main Campus with a master's in engineering.
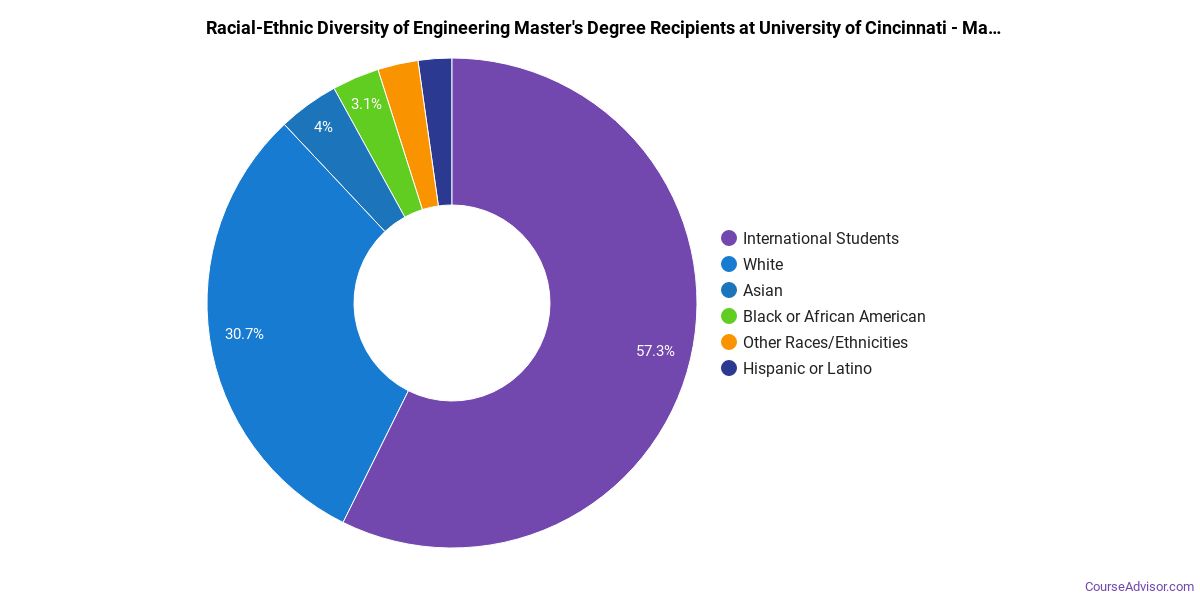
| Race/Ethnicity | Number of Students |
|---|---|
| Asian | 10 |
| Black or African American | 11 |
| Hispanic or Latino | 9 |
| White | 93 |
| International Students | 178 |
| Other Races/Ethnicities | 7 |
Concentrations Within Engineering
The following engineering concentations are available at University of Cincinnati - Main Campus. The completion numbers here include all graduates who receive any type of degree in this field from University of Cincinnati - Main Campus. Some of these focus areas may not be available for your degree level.
| Concentration | Annual Degrees Awarded |
|---|---|
| Mechanical Engineering | 331 |
| Electrical Engineering | 177 |
| Chemical Engineering | 121 |
| Civil Engineering | 107 |
| Aerospace & Aeronautical Engineering | 101 |
| Computer Engineering | 101 |
| Biomedical Engineering | 71 |
| Construction Engineering | 50 |
| Environmental Engineering | 42 |
| Architectural Engineering | 29 |
| Materials Engineering | 14 |
| Engineering Mechanics | 2 |
| Manufacturing Engineering | 1 |
| Robotics Engineering | 1 |
Related Majors
- Agriculture & Agriculture Operations
- Engineering Technologies
- Natural Resources & Conservation
- Mathematics & Statistics
- Physical Sciences
Careers That Engineering Grads May Go Into
A degree in engineering can lead to the following careers. Since job numbers and average salaries can vary by geographic location, we have only included the numbers for OH, the home state for University of Cincinnati - Main Campus.
| Occupation | Jobs in OH | Average Salary in OH |
|---|---|---|
| Software Applications Developers | 35,100 | $95,090 |
| Industrial Engineers | 15,440 | $84,060 |
| Mechanical Engineers | 15,300 | $81,020 |
| Industrial Production Managers | 11,380 | $109,190 |
| Cost Estimators | 10,200 | $64,700 |
References
*The racial-ethnic minorities count is calculated by taking the total number of students and subtracting white students, international students, and students whose race/ethnicity was unknown. This number is then divided by the total number of students at the school to obtain the racial-ethnic minorities percentage.
- College Factual
- National Center for Education Statistics
- O*NET Online
- Image Credit: By Bike756 under License
More about our data sources and methodologies.
Course Advisor provides higher-education, college and university, degree, program, career, salary, and other helpful information to students, faculty, institutions, and other internet audiences. Presented information and data are subject to change. Inclusion on this website does not imply or represent a direct relationship with the company, school, or brand. Information, though believed correct at time of publication, may not be correct, and no warranty is provided. Contact the schools to verify any information before relying on it. Financial aid may be available for those who qualify. The displayed options may include sponsored or recommended results, not necessarily based on your preferences.
© Course Advisor – All Rights Reserved.