Special Education at University of Cincinnati-Main Campus
What traits are you looking for in a school for Special Education, you may want to check out the program at University of Cincinnati-Main Campus. We’ve gathered the following information to help you decide.
University of Cincinnati-Main Campus is located in Cincinnati, OH.
During the most recent reporting year, 126 special education degrees were awarded at University of Cincinnati-Main Campus.
Featured schools near , edit
Studying Online at University of Cincinnati-Main Campus
Distance learning is available at University of Cincinnati-Main Campus. Among 45,026 students, 9,022 (20%) were enrolled entirely in distance education and 19,145 (43%) took at least some classes online.
Special Education Rankings at University of Cincinnati-Main Campus
Rankings can help you compare University of Cincinnati-Main Campus’s Special Education program to other colleges that offer this major.
Bachelor’s-Level Rankings
| Ranking | Scope | Rank |
|---|---|---|
| Best Schools (Quality) | Ohio | #3 of 22 |
| Best Value | Ohio | #18 of 22 |
| Best Schools (Quality) | Great Lakes (Region) | #22 of 73 |
| Best Value | Great Lakes (Region) | #63 of 73 |
| Best Schools (Quality) | Nationwide | #139 of 491 |
| Best Value | Nationwide | #380 of 486 |
Master’s-Level Rankings
| Ranking | Scope | Rank |
|---|---|---|
| Best Schools (Quality) | Ohio | #3 of 22 |
| Best Value | Ohio | #18 of 22 |
| Best Schools (Quality) | Great Lakes (Region) | #22 of 73 |
| Best Value | Great Lakes (Region) | #63 of 73 |
| Best Schools (Quality) | Nationwide | #139 of 491 |
| Best Value | Nationwide | #380 of 486 |
Earnings for Special Education Graduates from University of Cincinnati-Main Campus
Graduates of University of Cincinnati-Main Campus’s Special Education program earn at the following median levels (per the U.S. Department of Education’s College Scorecard):
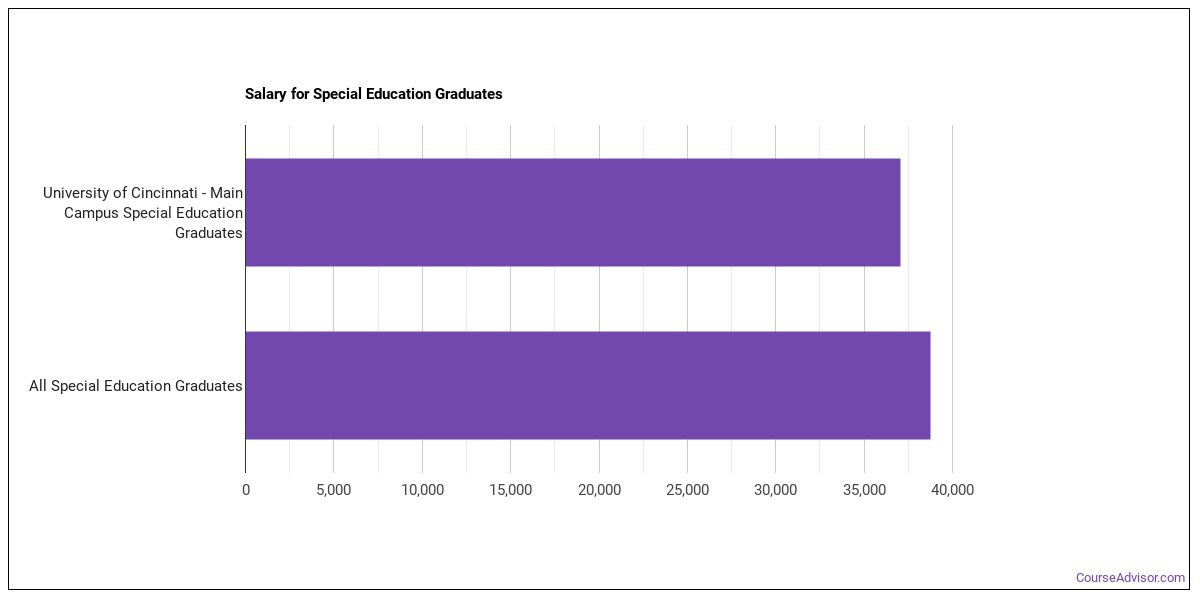
| Years After Graduation | Median Earnings |
|---|---|
| 1 year | $41,974 |
| 2 years | $40,458 |
Median Debt at Graduation
Median student loan debt for Special Education graduates from University of Cincinnati-Main Campus stands at $24,742.
Student Demographics & Diversity
The following sections describe the diversity of Special Education graduates at University of Cincinnati-Main Campus, by degree type.
Across all degree levels, Special Education graduates at University of Cincinnati-Main Campus are 89% women (112) and 11% men (14).
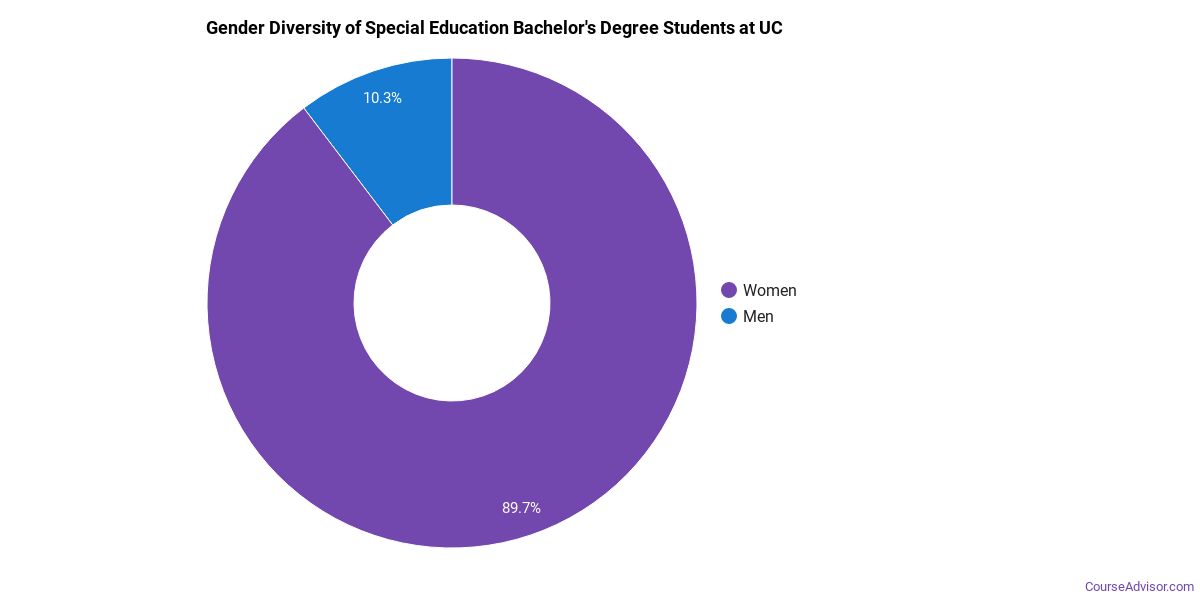
Special Education Bachelor’s Program at University of Cincinnati-Main Campus
Among the 14 bachelor’s special education degrees awarded at University of Cincinnati-Main Campus, 79% were women (11) and 21% were men (3).
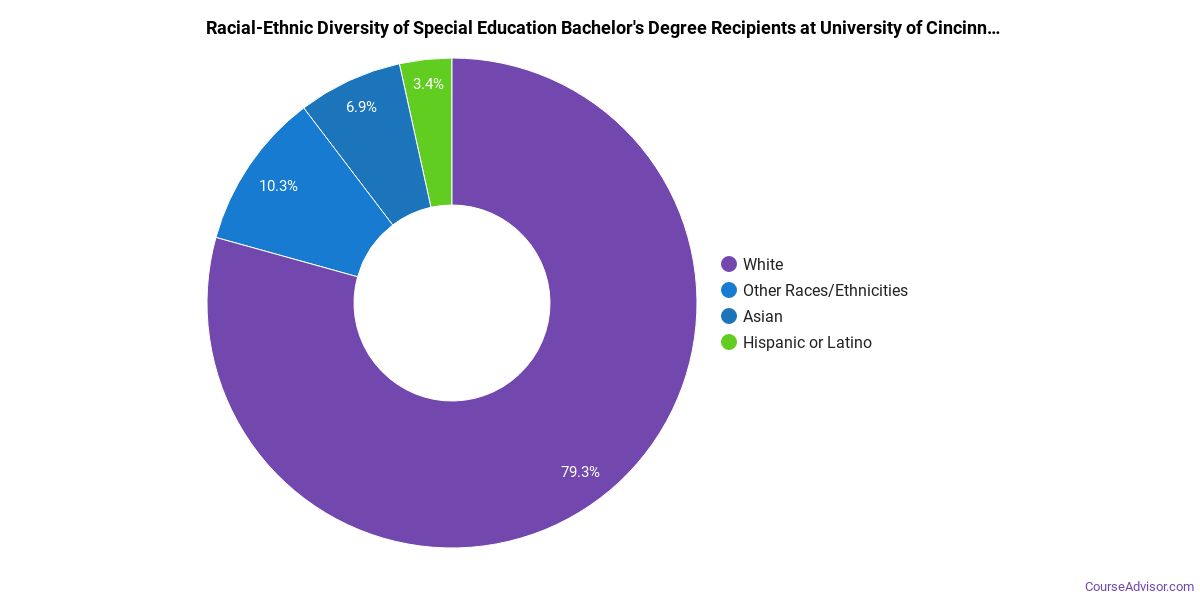
The following table and chart show the race/ethnicity of Special Education bachelor’s degree recipients at University of Cincinnati-Main Campus.
| Race / Ethnicity | Number of Graduates |
|---|---|
| White | 14 |
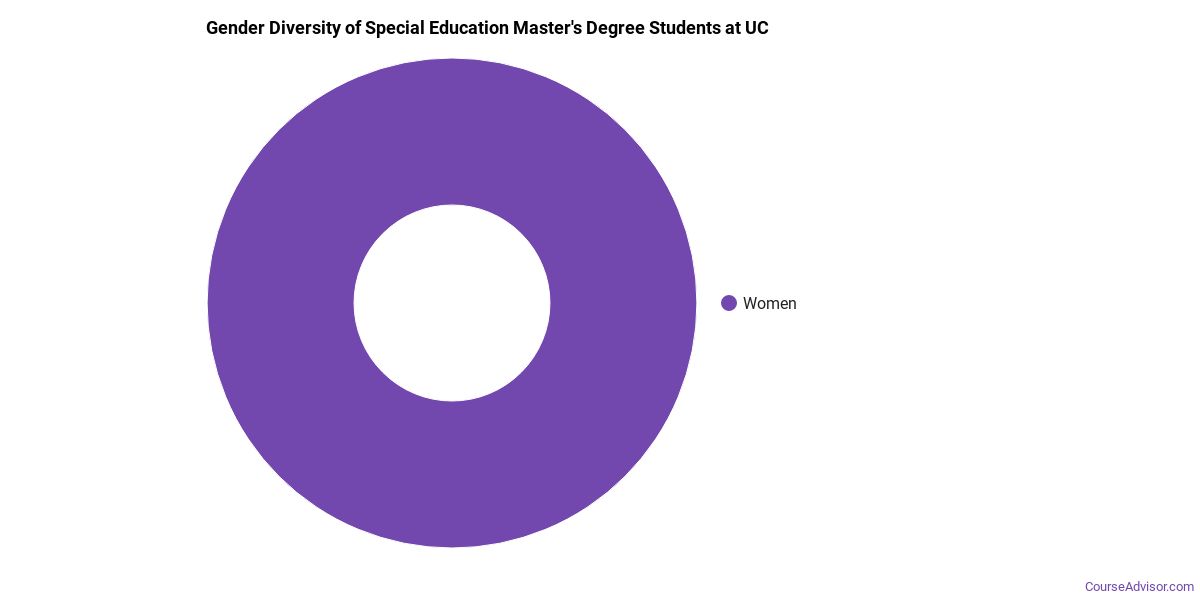
Special Education Master’s Program at University of Cincinnati-Main Campus
Of the 18 master’s special education graduates at University of Cincinnati-Main Campus, 83% were women (15) and 17% were men (3).
The following table and chart show the race/ethnicity of Special Education master’s degree recipients at University of Cincinnati-Main Campus.
| Race / Ethnicity | Number of Graduates |
|---|---|
| White | 13 |
| Black / African American | 1 |
| Asian | 1 |
| Two or More Races | 3 |
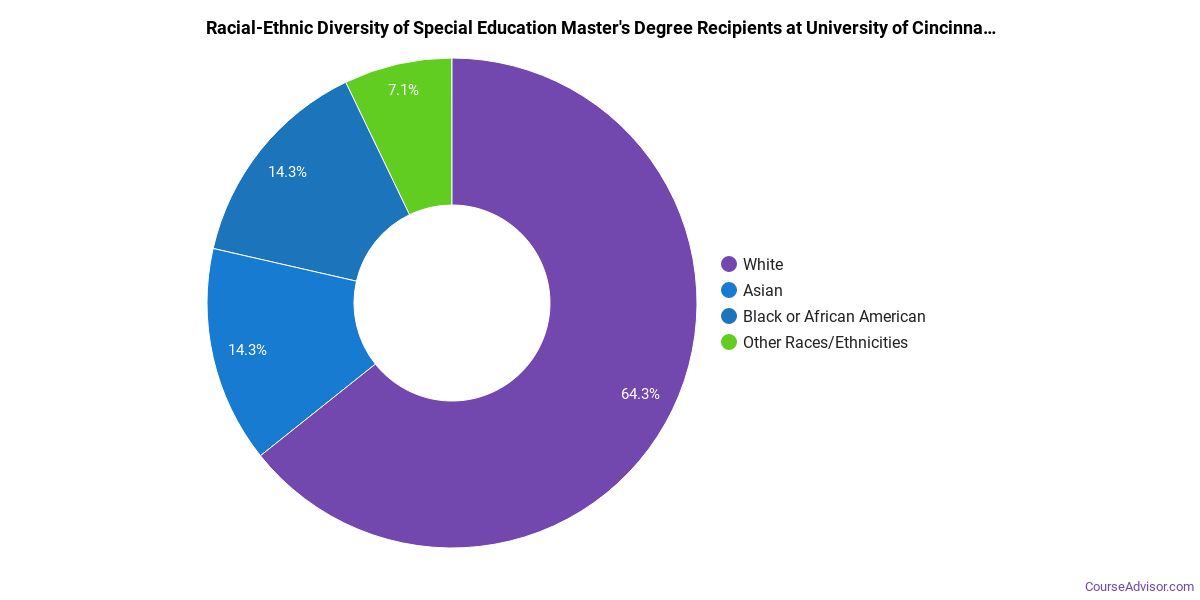
Racial-ethnic minorities make up 28% of Special Education master’s degree recipients at University of Cincinnati-Main Campus, lower than the national average of 33%.*
Special Education Doctoral Program at University of Cincinnati-Main Campus
Among the 1 doctoral special education degrees awarded at University of Cincinnati-Main Campus, 0% were women (0) and 100% were men (1).

The following table and chart show the race/ethnicity of Special Education doctoral degree recipients at University of Cincinnati-Main Campus.
| Race / Ethnicity | Number of Graduates |
|---|---|
| White | 1 |

*The racial-ethnic minorities figure is the total number of graduates minus White, international (nonresident), and unknown-race graduates.
More Specific Special Education Concentrations at University of Cincinnati-Main Campus
This Special Education program at University of Cincinnati-Main Campus breaks down into more specific concentrations:
| Concentration | Graduates |
|---|---|
| General Special Education | 44 |
| Teaching for the Deaf | 73 |
| Teaching for Gifted & Talented | 6 |
| Teaching for Autism | 3 |
Top-Paying Careers for Special Education Graduates
Students who finish Special Education program at University of Cincinnati-Main Campus pursue many career paths. The table below ranks the best-paid careers for Special Education majors, ordered by median annual salary:
| Occupation | Nationwide Median Wage |
|---|---|
| Education Teachers, Postsecondary | $98,329 |
| Teaching Assistants, Special Education | $96,801 |
| Special Education Teachers, All Other | $86,208 |
| Special Education Teachers, Middle School | $80,694 |
| Special Education Teachers, Secondary School | $79,680 |
| Adapted Physical Education Specialists | $77,976 |
| Special Education Teachers, Kindergarten | $73,597 |
| Interpreters and Translators | $52,627 |
| Special Education Teachers, Elementary School | $50,045 |
| Special Education Teachers, Preschool | $35,173 |
References
- IPEDS — Integrated Postsecondary Education Data System
- U.S. Department of Education — College Scorecard
- O*NET Online (Bureau of Labor Statistics)
- National Center for Education Statistics
More about our data sources and methodologies.
Course Advisor provides higher-education, college and university, degree, program, career, salary, and other helpful information to students, faculty, institutions, and other internet audiences. Presented information and data are subject to change. Inclusion on this website does not imply or represent a direct relationship with the company, school, or brand. Information, though believed correct at time of publication, may not be correct, and no warranty is provided. Contact the schools to verify any information before relying on it. Financial aid may be available for those who qualify. The displayed options may include sponsored or recommended results, not necessarily based on your preferences.
© Course Advisor – All Rights Reserved.