Ethnic Studies at University of California-Los Angeles
What traits are you looking for in a school for Ethnic Studies, take a look at what University of California-Los Angeles. The following information will help you decide if it is a good fit for you.
University of California-Los Angeles is in Los Angeles, CA.
In the most recent year for which we have data, 222 ethnic studies graduations were recorded at University of California-Los Angeles.
Featured schools near , edit
Online & Distance Learning at University of California-Los Angeles
Online coursework is an option at University of California-Los Angeles. Among 47,335 students, 785 (2%) were enrolled entirely in distance education and 5,535 (12%) took at least some classes online.
Ethnic Studies Rankings at University of California-Los Angeles
These rankings give you a sense of how University of California-Los Angeles’s Ethnic Studies program against peer institutions.
Bachelor’s-Level Rankings
| Ranking | Scope | Rank |
|---|---|---|
| Best Schools (Quality) | California | #12 of 39 |
| Best Schools (Quality) | Far Western (Region) | #15 of 50 |
| Best Value | California | #30 of 39 |
| Best Value | Far Western (Region) | #35 of 50 |
| Best Schools (Quality) | Nationwide | #46 of 143 |
| Best Value | Nationwide | #52 of 142 |
Master’s-Level Rankings
| Ranking | Scope | Rank |
|---|---|---|
| Best Schools (Quality) | California | #12 of 39 |
| Best Schools (Quality) | Far Western (Region) | #15 of 50 |
| Best Value | California | #30 of 39 |
| Best Value | Far Western (Region) | #35 of 50 |
| Best Schools (Quality) | Nationwide | #46 of 143 |
| Best Value | Nationwide | #52 of 142 |
Doctoral-Level Rankings
| Ranking | Scope | Rank |
|---|---|---|
| Best Schools (Quality) | California | #12 of 39 |
| Best Schools (Quality) | Far Western (Region) | #15 of 50 |
| Best Value | California | #30 of 39 |
| Best Value | Far Western (Region) | #35 of 50 |
| Best Schools (Quality) | Nationwide | #46 of 143 |
| Best Value | Nationwide | #52 of 142 |
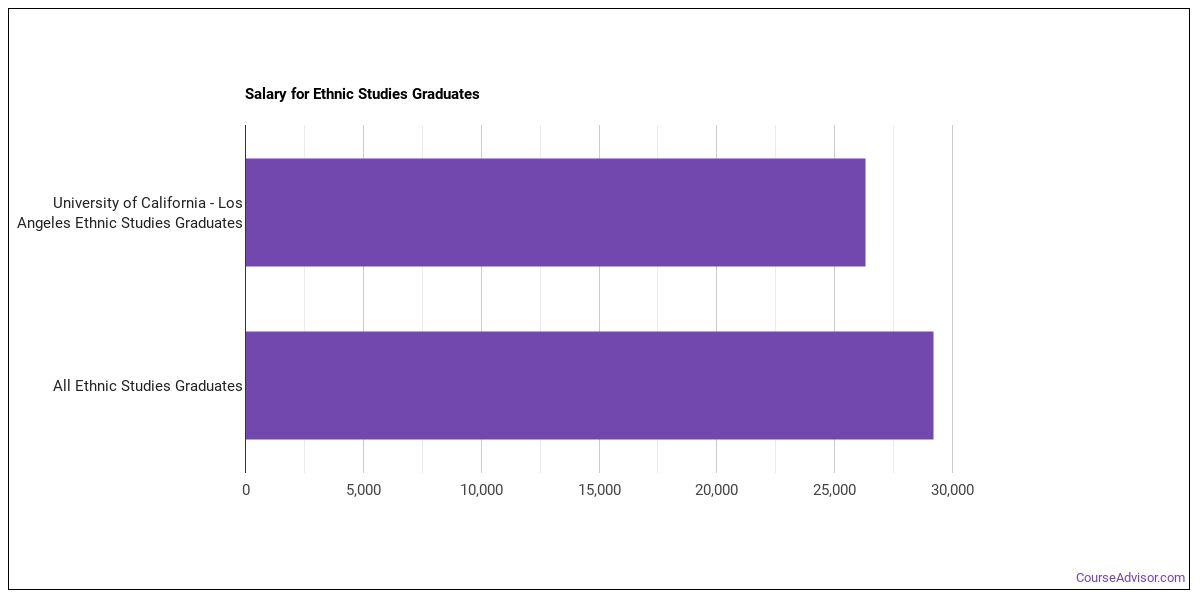
Earnings for Ethnic Studies Graduates from University of California-Los Angeles
Those who finish University of California-Los Angeles’s Ethnic Studies program earn at the following median levels (per the U.S. Department of Education’s College Scorecard):
| Years After Graduation | Median Earnings |
|---|---|
| 1 year | $26,296 |
| 2 years | $28,682 |
| 3 years | $40,016 |
| 4 years | $51,490 |
| 5 years | $61,195 |
How do these earnings stack up against the rest of the school? At the four-year mark, Ethnic Studies graduates from University of California-Los Angeles earn a median of $51,490, compared with $79,139 for all University of California-Los Angeles graduates — about 35% lower than the school-wide median.

Median Debt at Graduation
Typical debt at graduation for Ethnic Studies graduates from University of California-Los Angeles is $15,000.
Student Demographics & Diversity
Below you’ll find the student demographics for Ethnic Studies graduates at University of California-Los Angeles, broken down by degree level.
Across all degree levels, Ethnic Studies graduates at University of California-Los Angeles are 72% women (159) and 28% men (63).
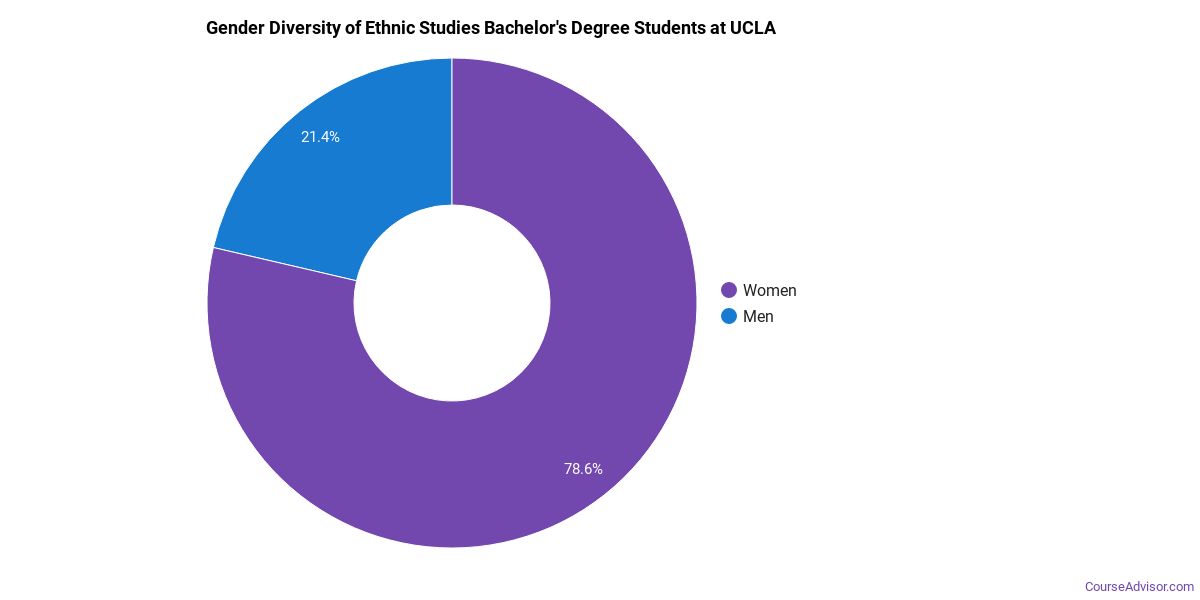
Ethnic Studies Bachelor’s Program at University of California-Los Angeles
Among the 196 bachelor’s ethnic studies degrees awarded at University of California-Los Angeles, 73% were women (143) and 27% were men (53).
The following table and chart show the race/ethnicity of Ethnic Studies bachelor’s degree recipients at University of California-Los Angeles.
| Race / Ethnicity | Number of Graduates |
|---|---|
| White | 21 |
| Hispanic / Latino | 110 |
| Black / African American | 23 |
| Asian | 24 |
| Native Hawaiian / Pacific Islander | 1 |
| Two or More Races | 11 |
| International (Nonresident) | 3 |
| Unknown | 3 |
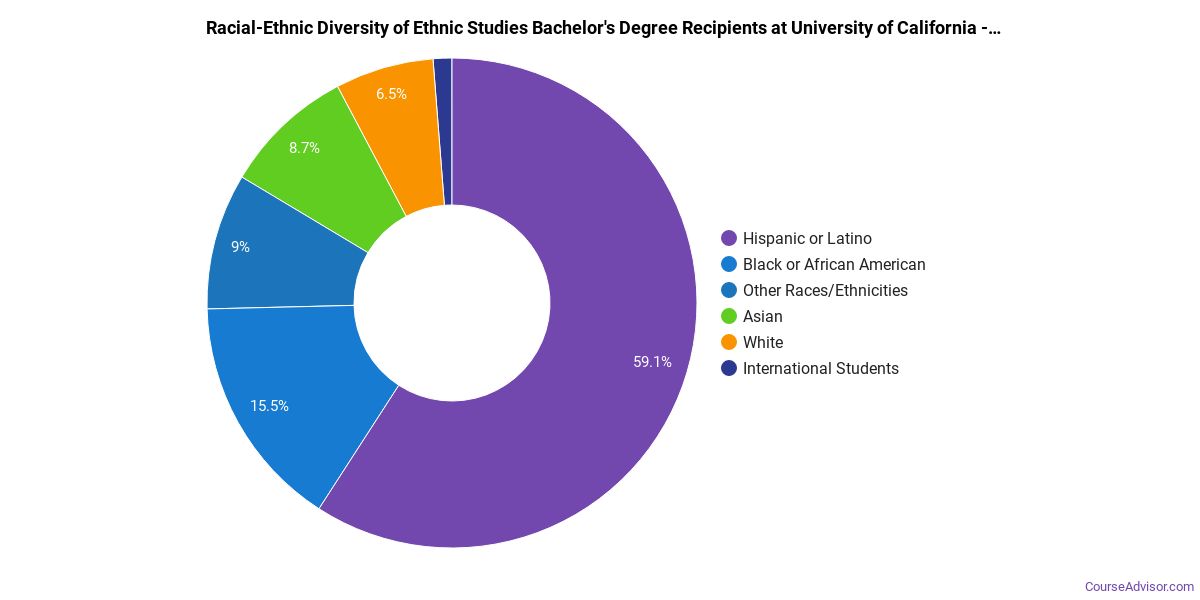
Minority students account for 86% of Ethnic Studies bachelor’s degree recipients at University of California-Los Angeles, higher than the national average of 66%.*
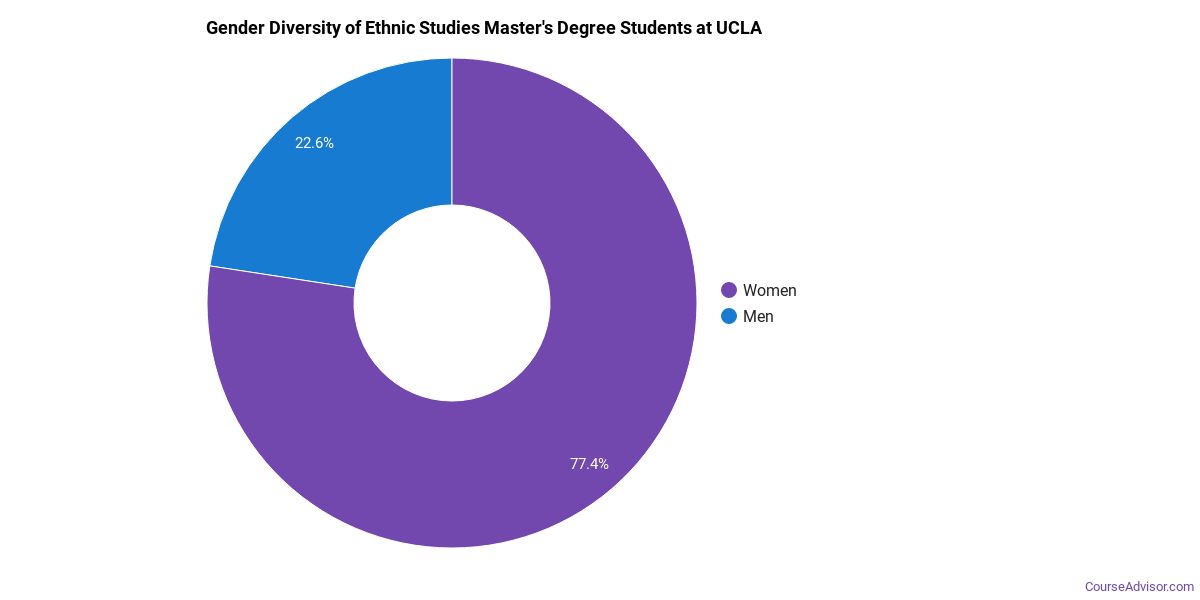
Ethnic Studies Master’s Program at University of California-Los Angeles
Of the 21 master’s ethnic studies graduates at University of California-Los Angeles, 57% were women (12) and 43% were men (9).
The following table and chart show the race/ethnicity of Ethnic Studies master’s degree recipients at University of California-Los Angeles.
| Race / Ethnicity | Number of Graduates |
|---|---|
| White | 3 |
| Hispanic / Latino | 4 |
| Black / African American | 2 |
| Asian | 6 |
| American Indian / Alaska Native | 1 |
| Two or More Races | 5 |
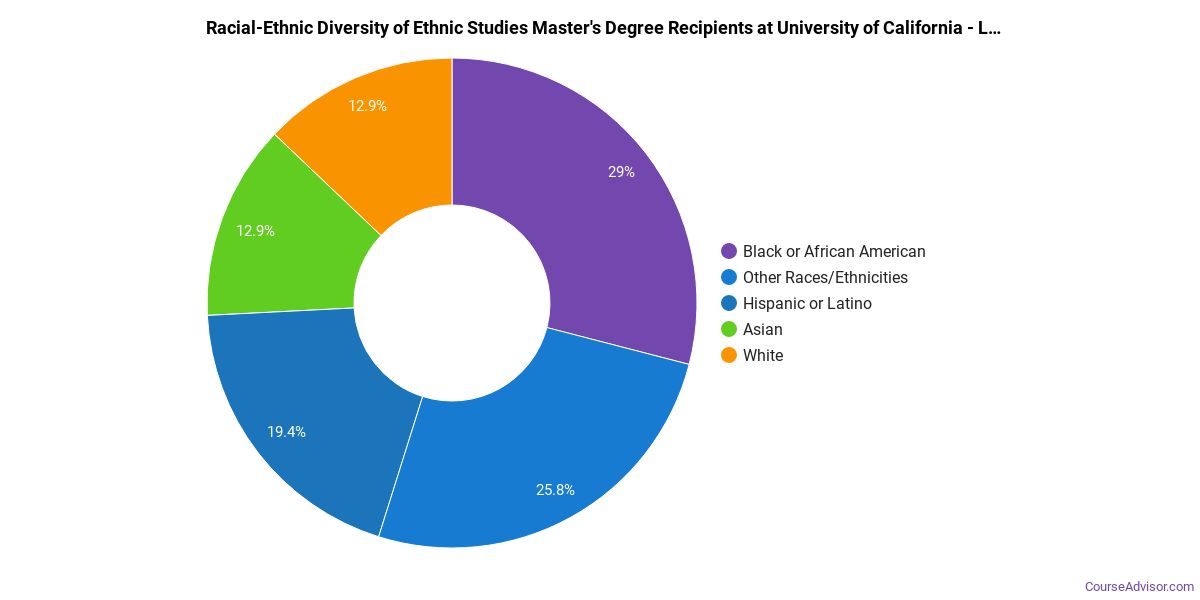
Minority students account for 86% of Ethnic Studies master’s degree recipients at University of California-Los Angeles, higher than the national average of 60%.*
Ethnic Studies Doctoral Program at University of California-Los Angeles
Among the 5 doctoral ethnic studies degrees awarded at University of California-Los Angeles, 80% were women (4) and 20% were men (1).

The following table and chart show the race/ethnicity of Ethnic Studies doctoral degree recipients at University of California-Los Angeles.
| Race / Ethnicity | Number of Graduates |
|---|---|
| White | 2 |
| Hispanic / Latino | 1 |
| Asian | 1 |
| International (Nonresident) | 1 |

Racial-ethnic minorities make up 40% of Ethnic Studies doctoral degree recipients at University of California-Los Angeles, below the national average of 60%.*
*The racial-ethnic minorities figure is the total number of graduates minus White, international (nonresident), and unknown-race graduates.
More Specific Ethnic Studies Concentrations at University of California-Los Angeles
This Ethnic Studies program at University of California-Los Angeles breaks down into more specific concentrations:
| Concentration | Graduates |
|---|---|
| African American Studies | 42 |
| Native American Studies | 6 |
| Latino Studies | 75 |
| Asian-American Studies | 25 |
| Disability Studies | 3 |
| Other Ethnic Studies | 71 |
Highest-Paying Careers for Ethnic Studies Graduates
Those who complete Ethnic Studies program at University of California-Los Angeles go on to a range of careers. The table below ranks the best-paid careers for Ethnic Studies graduates, ordered by median annual salary:
| Occupation | Nationwide Median Wage |
|---|---|
| Interpreters and Translators | $52,627 |
| Area, Ethnic, and Cultural Studies Teachers, Postsecondary | $47,517 |
References
- IPEDS — Integrated Postsecondary Education Data System
- U.S. Department of Education — College Scorecard
- O*NET Online (Bureau of Labor Statistics)
- National Center for Education Statistics
More about our data sources and methodologies.
Course Advisor provides higher-education, college and university, degree, program, career, salary, and other helpful information to students, faculty, institutions, and other internet audiences. Presented information and data are subject to change. Inclusion on this website does not imply or represent a direct relationship with the company, school, or brand. Information, though believed correct at time of publication, may not be correct, and no warranty is provided. Contact the schools to verify any information before relying on it. Financial aid may be available for those who qualify. The displayed options may include sponsored or recommended results, not necessarily based on your preferences.
© Course Advisor – All Rights Reserved.