Public Policy at Trinity College
If you are interested in studying Public Policy, you may want to check out the program at Trinity College. The following information will help you decide if it is a good fit for you.
Trinity College sits in Hartford, CT.
During the most recent reporting year, 48 public policy degrees were granted at Trinity College.
Featured schools near , edit
Online Class Availability at Trinity College
Trinity College primarily offers on-campus instruction; distance-education enrollment is limited.
Public Policy Rankings at Trinity College
Use these rankings to compare Trinity College’s Public Policy program against peer institutions.
Bachelor’s-Level Rankings
| Ranking | Scope | Rank |
|---|---|---|
| Best Schools (Quality) | Connecticut | #1 of 3 |
| Best Value | Connecticut | #3 of 3 |
| Best Schools (Quality) | New England (Region) | #4 of 15 |
| Best Value | New England (Region) | #14 of 15 |
| Best Schools (Quality) | Nationwide | #39 of 96 |
| Best Value | Nationwide | #86 of 95 |
Master’s-Level Rankings
| Ranking | Scope | Rank |
|---|---|---|
| Best Schools (Quality) | Connecticut | #1 of 3 |
| Best Value | Connecticut | #3 of 3 |
| Best Schools (Quality) | New England (Region) | #4 of 15 |
| Best Value | New England (Region) | #14 of 15 |
| Best Schools (Quality) | Nationwide | #39 of 96 |
| Best Value | Nationwide | #86 of 95 |
Earnings for Public Policy Graduates from Trinity College
Those who finish Trinity College’s Public Policy program report the following median earnings (per the U.S. Department of Education’s College Scorecard):
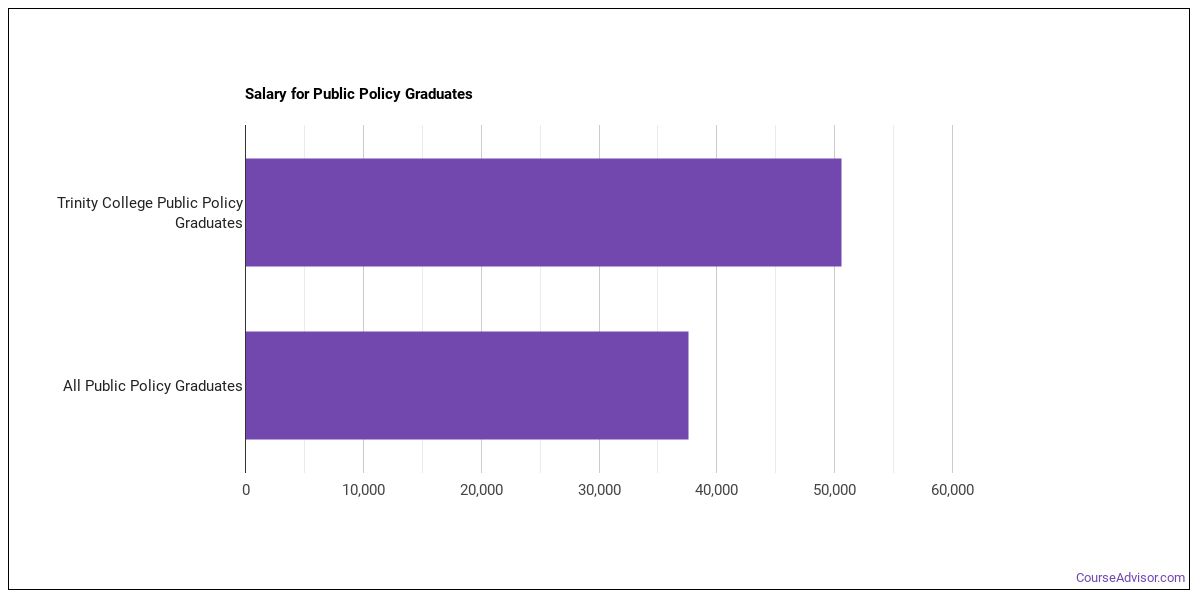
| Years After Graduation | Median Earnings |
|---|---|
| 1 year | $50,564 |
| 2 years | $47,260 |
Median Debt at Graduation
Typical debt at graduation for Public Policy graduates from Trinity College stands at $23,161.
Student Demographics & Diversity
The following sections describe the student demographics for Public Policy graduates at Trinity College, broken down by degree level.
Looking at the program as a whole, Public Policy graduates at Trinity College are 44% women (21) and 56% men (27).
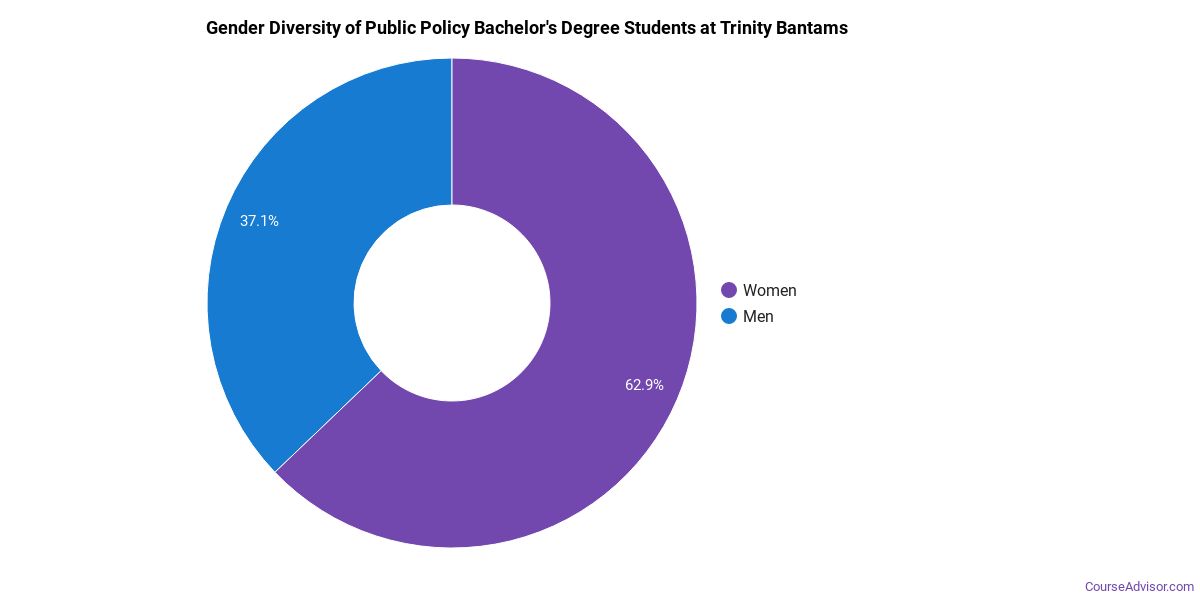
Public Policy Bachelor’s Program at Trinity College
Of the 41 bachelor’s public policy degrees awarded at Trinity College, 37% were women (15) and 63% were men (26).
The following table and chart show the race/ethnicity of Public Policy bachelor’s degree recipients at Trinity College.
| Race / Ethnicity | Number of Graduates |
|---|---|
| White | 31 |
| Hispanic / Latino | 5 |
| Two or More Races | 2 |
| International (Nonresident) | 1 |
| Unknown | 2 |
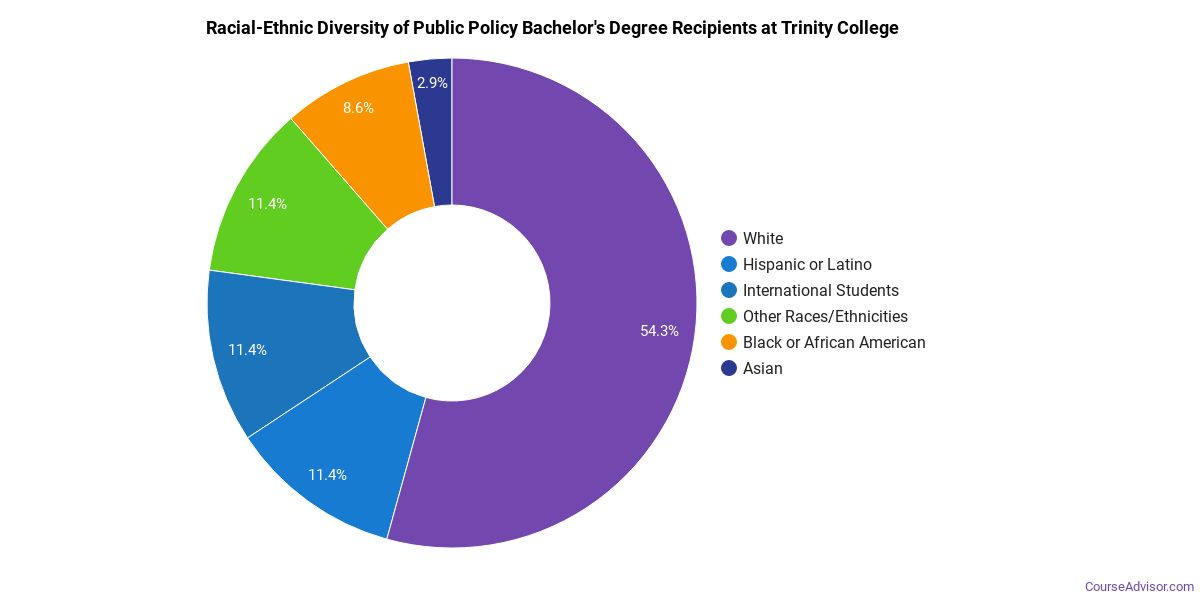
Minority students account for 17% of Public Policy bachelor’s degree recipients at Trinity College, below the national average of 45%.*
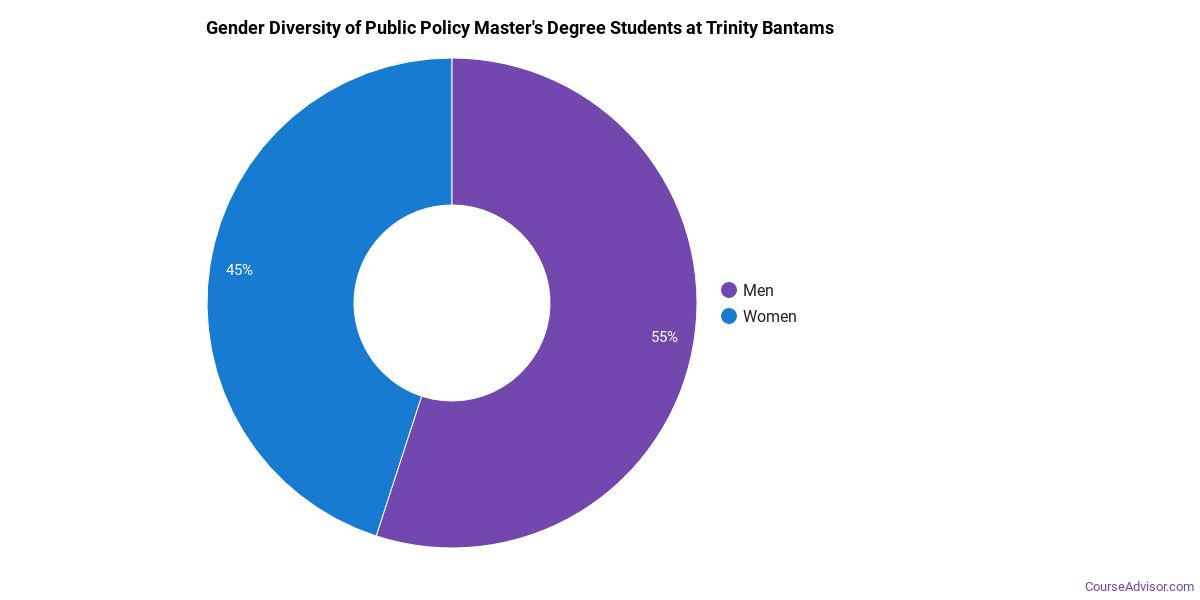
Public Policy Master’s Program at Trinity College
Of the 7 master’s public policy graduates at Trinity College, 86% were women (6) and 14% were men (1).
The following table and chart show the race/ethnicity of Public Policy master’s degree recipients at Trinity College.
| Race / Ethnicity | Number of Graduates |
|---|---|
| White | 3 |
| Hispanic / Latino | 1 |
| Black / African American | 2 |
| International (Nonresident) | 1 |
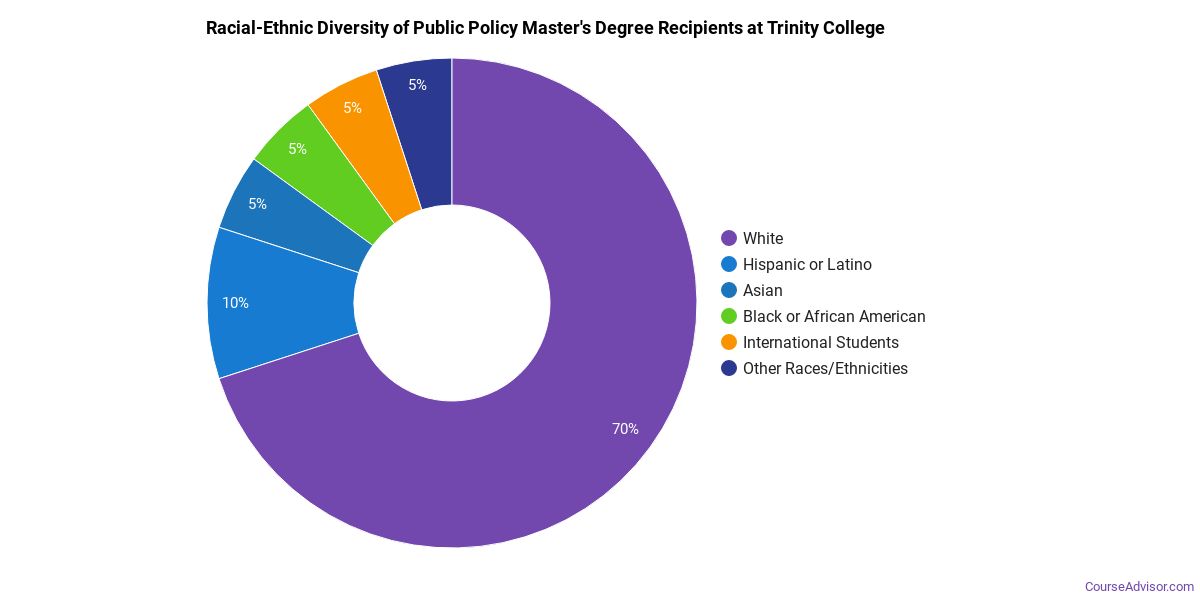
Minority students account for 43% of Public Policy master’s degree recipients at Trinity College, higher than the national average of 33%.*
*The racial-ethnic minorities figure is the total number of graduates minus White, international (nonresident), and unknown-race graduates.
More Specific Public Policy Concentrations at Trinity College
The Public Policy program at Trinity College breaks down into more specific concentrations:
| Concentration | Graduates |
|---|---|
| General Public Policy Analysis | 48 |
Best-Paid Careers for Public Policy Graduates
Those who complete Public Policy program at Trinity College pursue many career paths. Below are the best-paid careers for Public Policy graduates, ordered by median annual salary:
| Occupation | Nationwide Median Wage |
|---|---|
| Legislators | $167,600 |
| Medical and Health Services Managers | $129,557 |
| Education Teachers, Postsecondary | $98,329 |
| Political Scientists | $71,521 |
| Political Science Teachers, Postsecondary | $66,472 |
| Transportation Planners | $50,855 |
| Health Specialties Teachers, Postsecondary | $46,663 |
| Social Scientists and Related Workers, All Other | $42,168 |
| Social Science Research Assistants | $41,630 |
References
- IPEDS — Integrated Postsecondary Education Data System
- U.S. Department of Education — College Scorecard
- O*NET Online (Bureau of Labor Statistics)
- National Center for Education Statistics
More about our data sources and methodologies.
Course Advisor provides higher-education, college and university, degree, program, career, salary, and other helpful information to students, faculty, institutions, and other internet audiences. Presented information and data are subject to change. Inclusion on this website does not imply or represent a direct relationship with the company, school, or brand. Information, though believed correct at time of publication, may not be correct, and no warranty is provided. Contact the schools to verify any information before relying on it. Financial aid may be available for those who qualify. The displayed options may include sponsored or recommended results, not necessarily based on your preferences.
© Course Advisor – All Rights Reserved.