Computer Engineering at The University of Texas at San Antonio
What traits are you looking for in a school for Computer Engineering, consider the program at The University of Texas at San Antonio. Get started with the following essential facts.
The University of Texas at San Antonio is in San Antonio, TX.
In the most recent year for which we have data, 87 computer engineering degrees were granted at The University of Texas at San Antonio.
Featured schools near , edit
Online & Distance Learning at The University of Texas at San Antonio
Online coursework is an option at The University of Texas at San Antonio. Of 35,770 students, 4,185 (12%) were enrolled entirely in distance education and 19,560 (55%) took at least some classes online.
Computer Engineering Rankings at The University of Texas at San Antonio
Rankings can help you compare The University of Texas at San Antonio’s Computer Engineering program against peer institutions.
Bachelor’s-Level Rankings
| Ranking | Scope | Rank |
|---|---|---|
| Best Value | Texas | #7 of 15 |
| Best Value | Southwest (Region) | #8 of 24 |
| Best Schools (Quality) | Texas | #13 of 15 |
| Best Schools (Quality) | Southwest (Region) | #22 of 25 |
| Best Value | Nationwide | #72 of 229 |
| Best Schools (Quality) | Nationwide | #214 of 230 |
Master’s-Level Rankings
| Ranking | Scope | Rank |
|---|---|---|
| Best Value | Texas | #7 of 15 |
| Best Value | Southwest (Region) | #8 of 24 |
| Best Schools (Quality) | Texas | #13 of 15 |
| Best Schools (Quality) | Southwest (Region) | #22 of 25 |
| Best Value | Nationwide | #72 of 229 |
| Best Schools (Quality) | Nationwide | #214 of 230 |
Earnings for Computer Engineering Graduates from The University of Texas at San Antonio
Students who complete The University of Texas at San Antonio’s Computer Engineering program earn the following amounts (per the U.S. Department of Education’s College Scorecard):
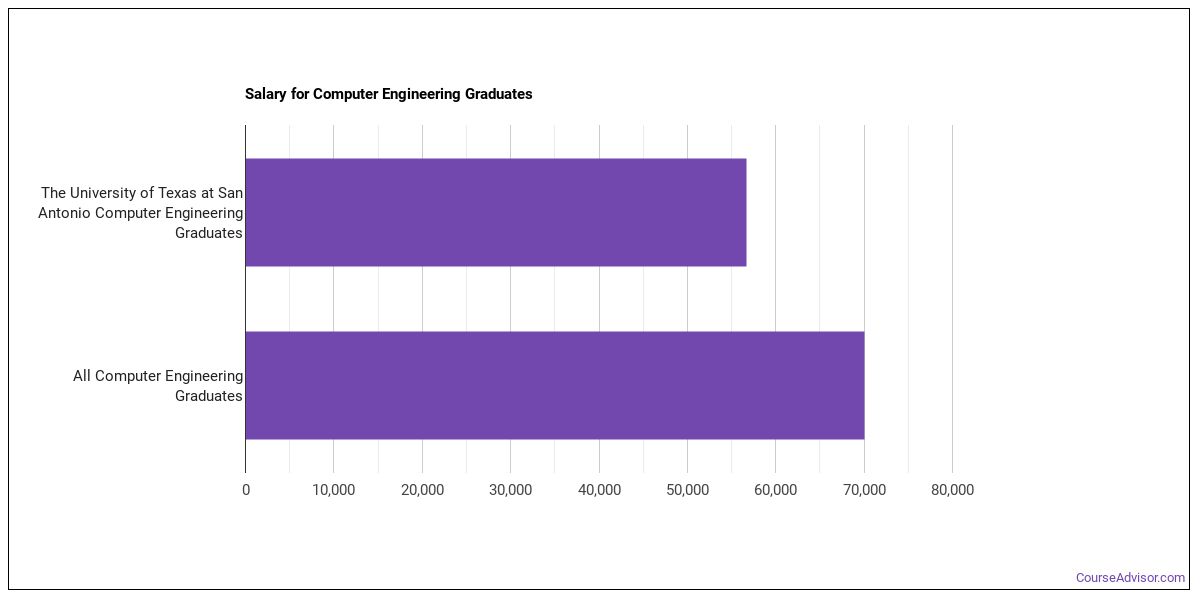
| Years After Graduation | Median Earnings |
|---|---|
| 1 year | $56,666 |
| 2 years | $68,907 |
Median Debt at Graduation
The median debt for Computer Engineering graduates from The University of Texas at San Antonio is $26,947.
Student Demographics & Diversity
Below you’ll find the student demographics for Computer Engineering graduates at The University of Texas at San Antonio, by degree type.
Across all degree levels, Computer Engineering graduates at The University of Texas at San Antonio are 29% women (25) and 71% men (62).
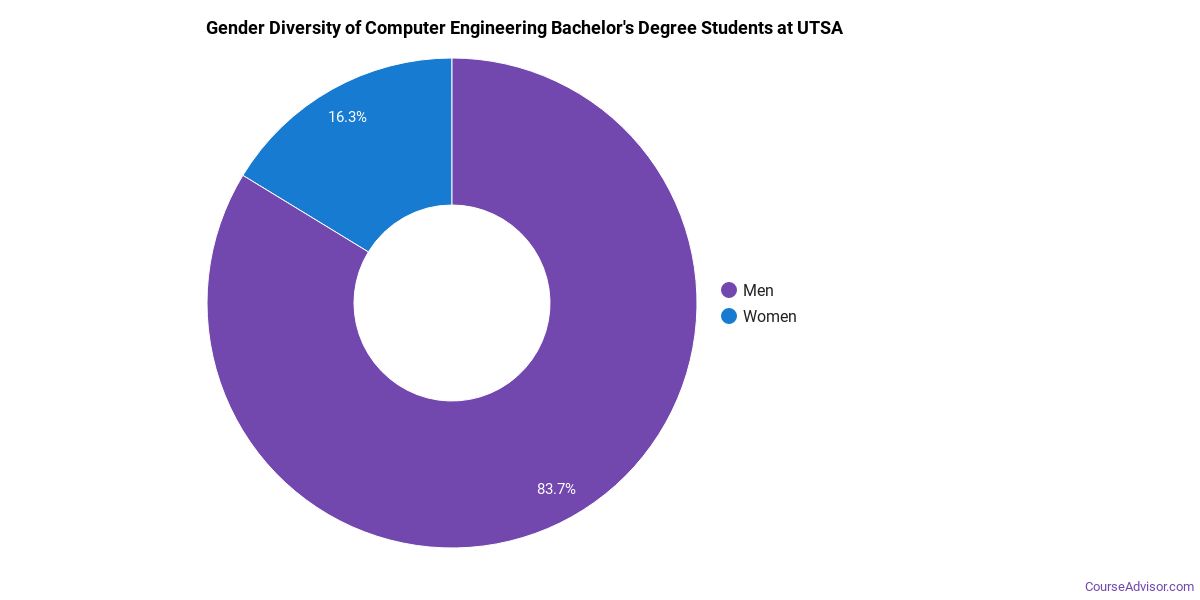
Computer Engineering Bachelor’s Program at The University of Texas at San Antonio
Among the 73 bachelor’s computer engineering graduates at The University of Texas at San Antonio, 27% were women (20) and 73% were men (53).
The following table and chart show the race/ethnicity of Computer Engineering bachelor’s degree recipients at The University of Texas at San Antonio.
| Race / Ethnicity | Number of Graduates |
|---|---|
| White | 12 |
| Hispanic / Latino | 37 |
| Black / African American | 10 |
| Asian | 9 |
| Two or More Races | 2 |
| International (Nonresident) | 3 |
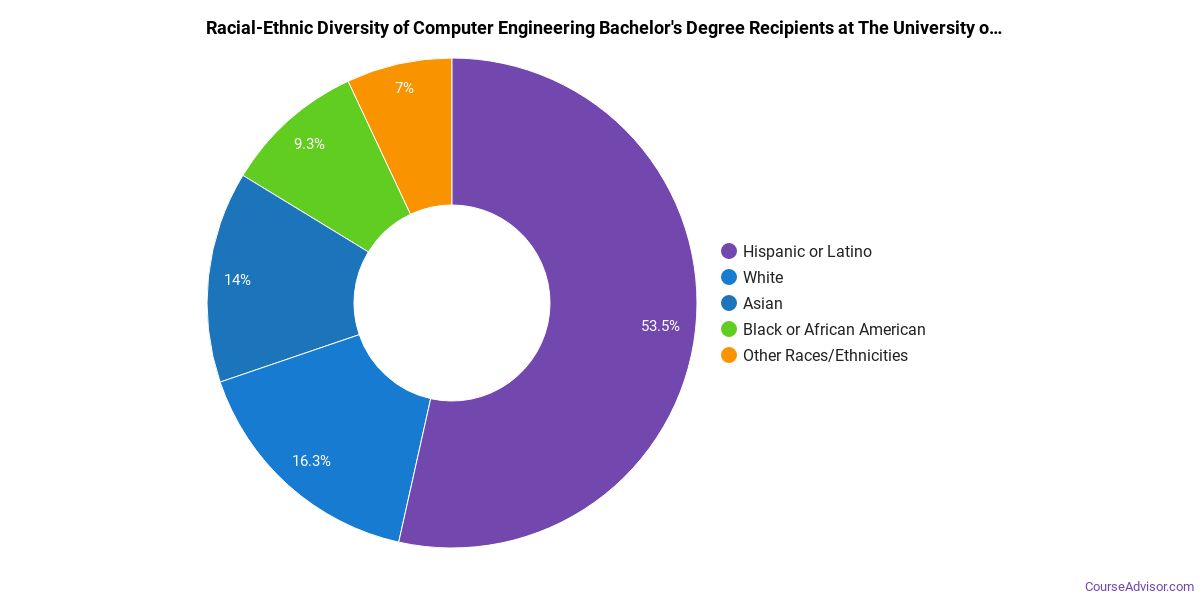
Racial-ethnic minorities make up 79% of Computer Engineering bachelor’s degree recipients at The University of Texas at San Antonio, above the national average of 45%.*
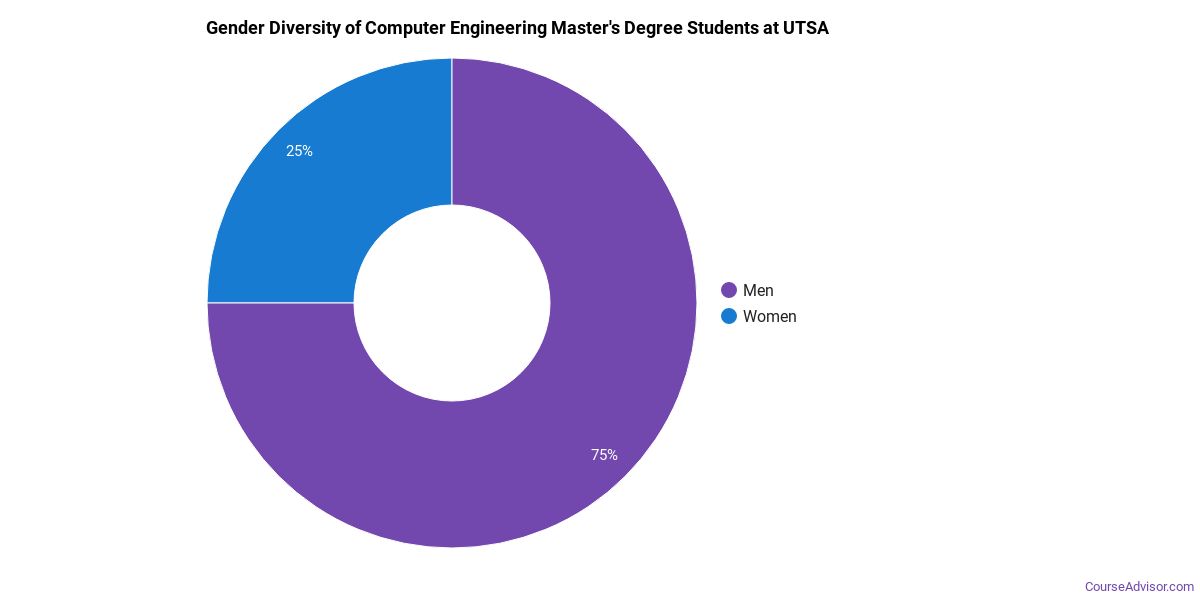
Computer Engineering Master’s Program at The University of Texas at San Antonio
Of the 14 master’s computer engineering degrees awarded at The University of Texas at San Antonio, 36% were women (5) and 64% were men (9).
The following table and chart show the race/ethnicity of Computer Engineering master’s degree recipients at The University of Texas at San Antonio.
| Race / Ethnicity | Number of Graduates |
|---|---|
| White | 1 |
| Hispanic / Latino | 5 |
| Asian | 2 |
| Two or More Races | 1 |
| International (Nonresident) | 5 |
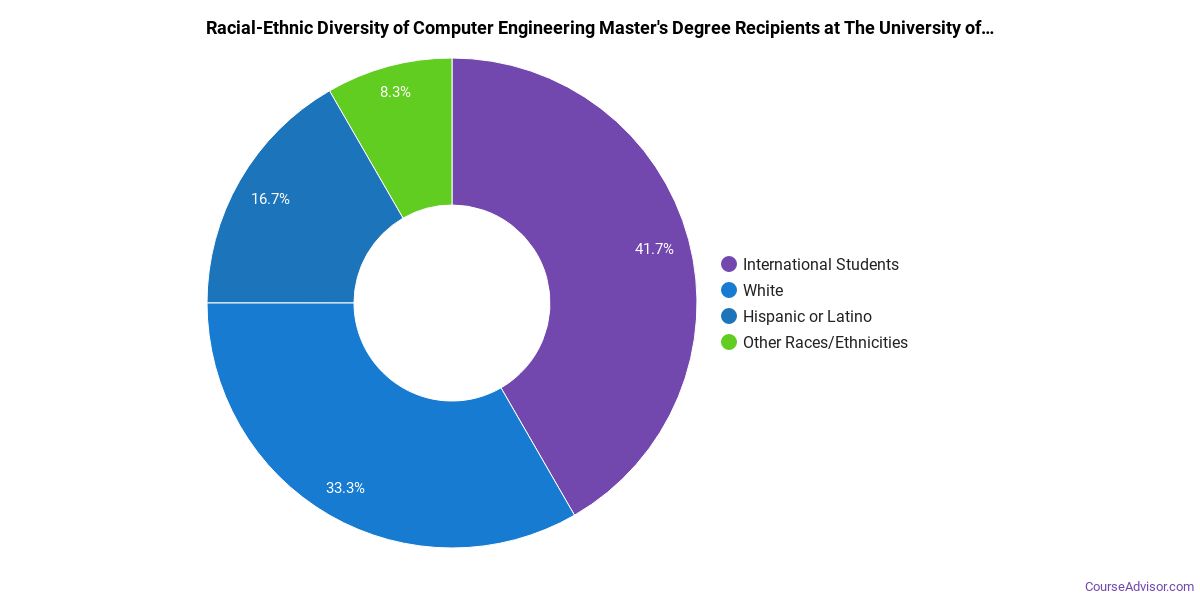
Racial-ethnic minorities make up 57% of Computer Engineering master’s degree recipients at The University of Texas at San Antonio, higher than the national average of 12%.*
*The racial-ethnic minorities figure is the total number of graduates minus White, international (nonresident), and unknown-race graduates.
More Specific Computer Engineering Concentrations at The University of Texas at San Antonio
The Computer Engineering program at The University of Texas at San Antonio offers more specialized concentrations:
| Concentration | Graduates |
|---|---|
| General Computer Engineering | 87 |
Highest-Paying Careers for Computer Engineering Graduates
Students who finish Computer Engineering program at The University of Texas at San Antonio work across a variety of fields. The table below ranks the best-paid careers for Computer Engineering majors, ordered by median annual salary:
| Occupation | Nationwide Median Wage |
|---|---|
| Database Architects | $148,480 |
| Telecommunications Engineering Specialists | $117,478 |
| Data Warehousing Specialists | $117,424 |
| Architectural and Engineering Managers | $101,277 |
| Biofuels/Biodiesel Technology and Product Development Managers | $89,263 |
| Software Quality Assurance Analysts and Testers | $80,062 |
| Engineering Teachers, Postsecondary | $79,889 |
| Software Developers | $76,447 |
| Computer Hardware Engineers | $63,909 |
| Computer Network Architects | $63,411 |
References
- IPEDS — Integrated Postsecondary Education Data System
- U.S. Department of Education — College Scorecard
- O*NET Online (Bureau of Labor Statistics)
- National Center for Education Statistics
More about our data sources and methodologies.
Course Advisor provides higher-education, college and university, degree, program, career, salary, and other helpful information to students, faculty, institutions, and other internet audiences. Presented information and data are subject to change. Inclusion on this website does not imply or represent a direct relationship with the company, school, or brand. Information, though believed correct at time of publication, may not be correct, and no warranty is provided. Contact the schools to verify any information before relying on it. Financial aid may be available for those who qualify. The displayed options may include sponsored or recommended results, not necessarily based on your preferences.
© Course Advisor – All Rights Reserved.