Music at The University of Montana
What traits are you looking for in a school for Music, consider the program at The University of Montana. We’ve gathered the following information to help you decide.
The University of Montana sits in Missoula, MT.
During the most recent reporting year, 23 music degrees were awarded at The University of Montana.
Featured schools near , edit
Studying Online at The University of Montana
Distance learning is available at The University of Montana. Of 10,811 students, 2,398 (22%) studied exclusively online and 3,174 (29%) took at least some classes online.
Music Rankings at The University of Montana
Rankings can help you compare The University of Montana’s Music program to other colleges that offer this major.
Bachelor’s-Level Rankings
| Ranking | Scope | Rank |
|---|---|---|
| Best Value | Montana | #1 of 2 |
| Best Schools (Quality) | Montana | #2 of 2 |
| Best Value | Rocky Mountains (Region) | #13 of 20 |
| Best Schools (Quality) | Rocky Mountains (Region) | #16 of 20 |
| Best Value | Nationwide | #240 of 421 |
| Best Schools (Quality) | Nationwide | #336 of 423 |
Master’s-Level Rankings
| Ranking | Scope | Rank |
|---|---|---|
| Best Value | Montana | #1 of 2 |
| Best Schools (Quality) | Montana | #2 of 2 |
| Best Value | Rocky Mountains (Region) | #13 of 20 |
| Best Schools (Quality) | Rocky Mountains (Region) | #16 of 20 |
| Best Value | Nationwide | #240 of 421 |
| Best Schools (Quality) | Nationwide | #336 of 423 |
Earnings for Music Graduates from The University of Montana
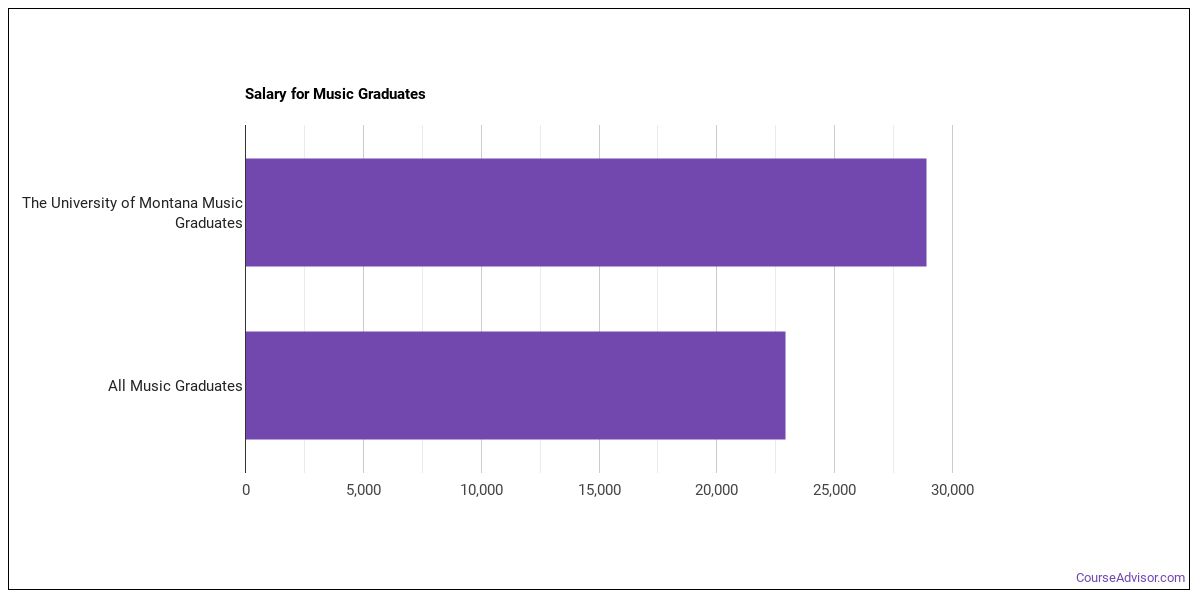
Students who complete The University of Montana’s Music program report the following median earnings (per the U.S. Department of Education’s College Scorecard):
| Years After Graduation | Median Earnings |
|---|---|
| 2 years | $29,685 |
| 3 years | $32,314 |
| 4 years | $35,740 |
| 5 years | $39,637 |
How do these earnings stack up against the rest of the school? At the four-year mark, Music graduates from The University of Montana earn a median of $35,740, compared with $49,692 for all The University of Montana graduates — about 28% lower than the school-wide median.

Student Demographics & Diversity
Take a look at the student demographics for Music graduates at The University of Montana, by degree type.
Across all degree levels, Music graduates at The University of Montana are 52% women (12) and 48% men (11).
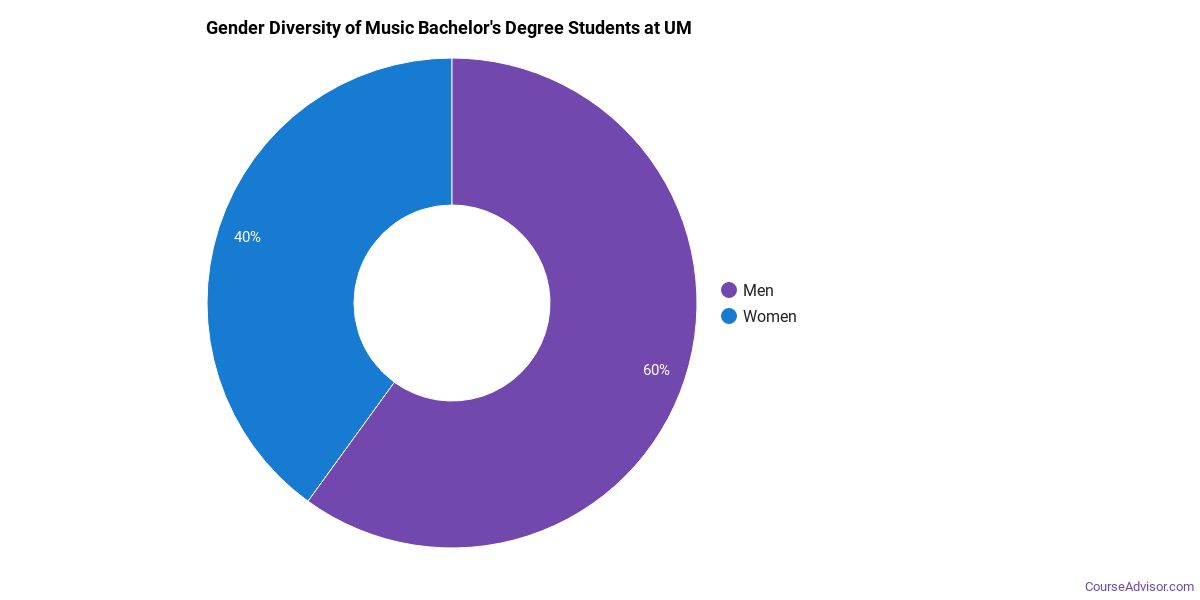
Music Bachelor’s Program at The University of Montana
Among the 20 bachelor’s music graduates at The University of Montana, 60% were women (12) and 40% were men (8).
The following table and chart show the race/ethnicity of Music bachelor’s degree recipients at The University of Montana.
| Race / Ethnicity | Number of Graduates |
|---|---|
| White | 16 |
| Hispanic / Latino | 1 |
| Two or More Races | 3 |
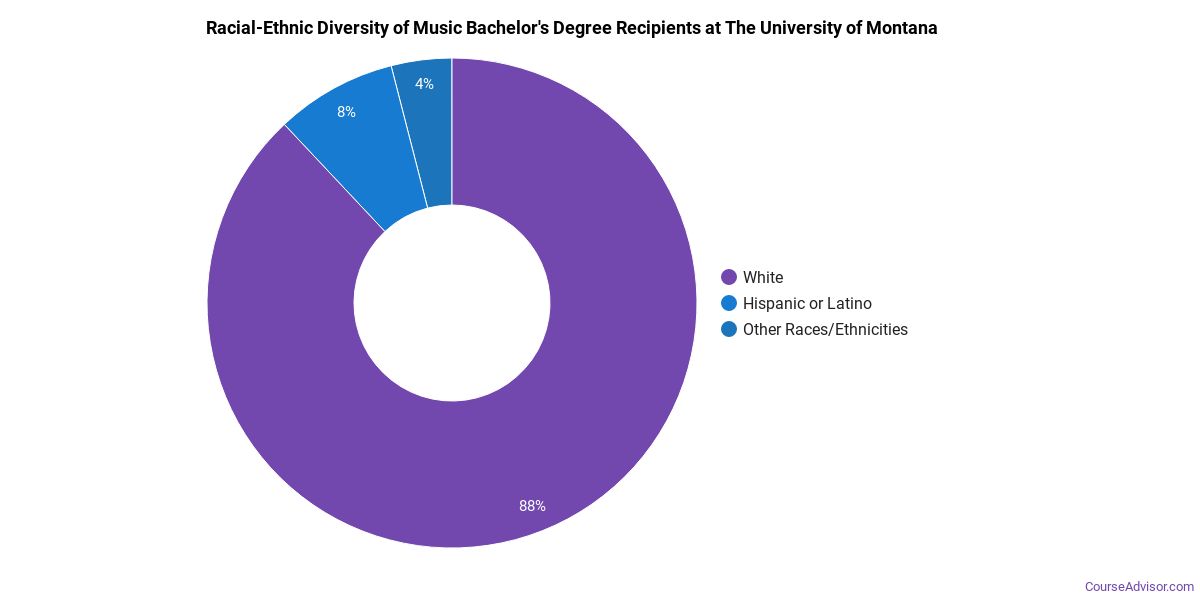
Racial-ethnic minorities make up 20% of Music bachelor’s degree recipients at The University of Montana, below the national average of 34%.*
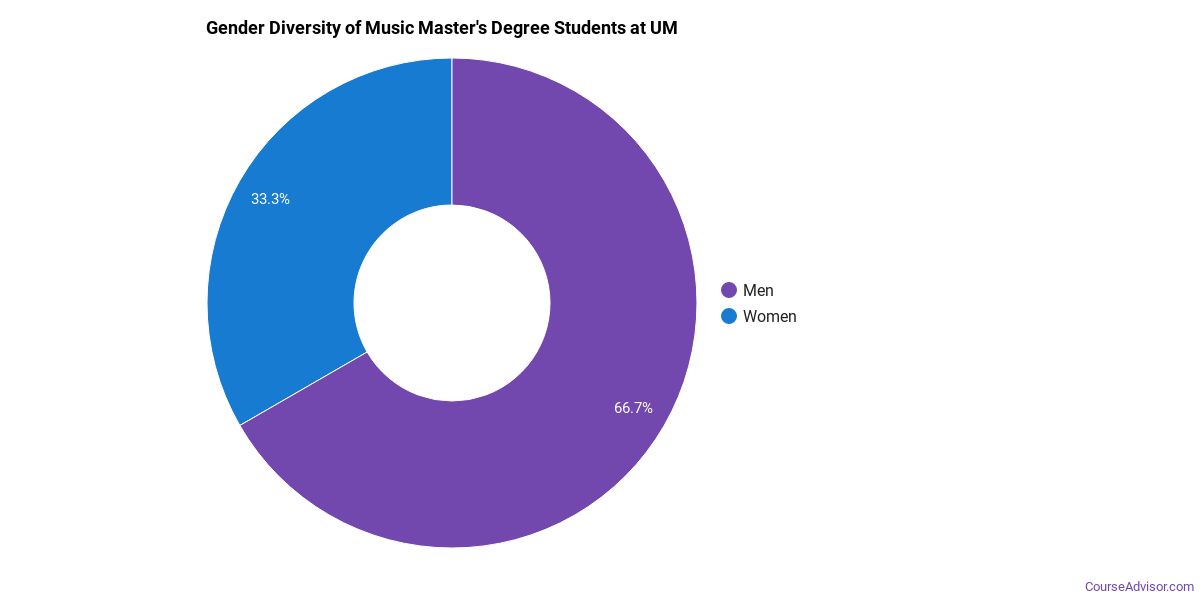
Music Master’s Program at The University of Montana
Of the 3 master’s music degrees awarded at The University of Montana, 0% were women (0) and 100% were men (3).
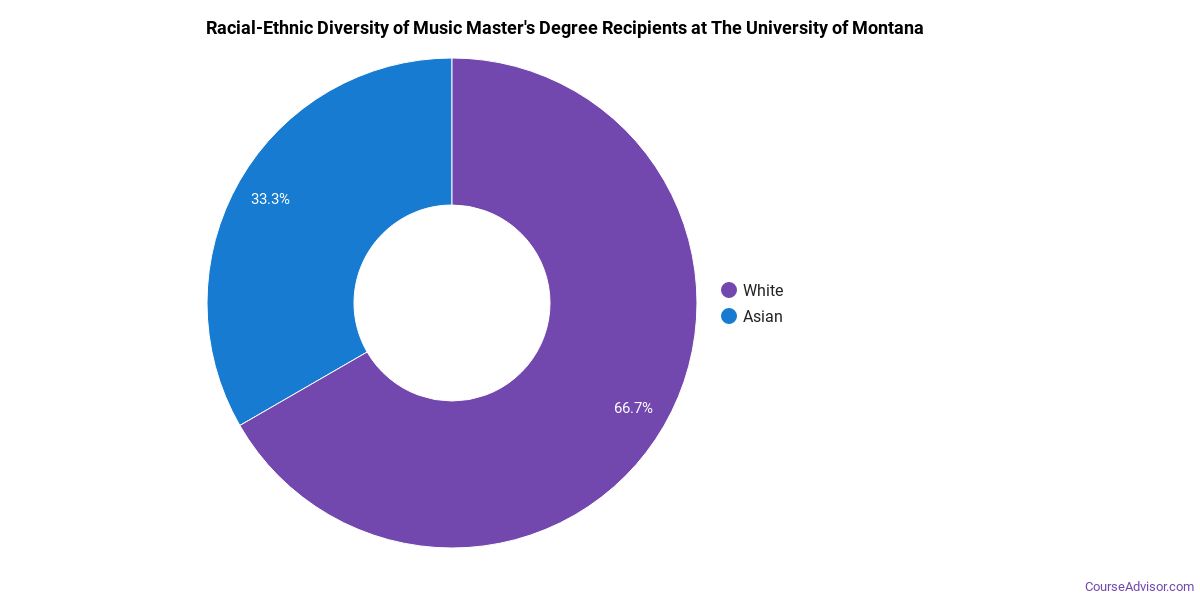
The following table and chart show the race/ethnicity of Music master’s degree recipients at The University of Montana.
| Race / Ethnicity | Number of Graduates |
|---|---|
| White | 3 |
*The racial-ethnic minorities figure is the total number of graduates minus White, international (nonresident), and unknown-race graduates.
More Specific Music Concentrations at The University of Montana
The Music program at The University of Montana includes the following sub-specializations:
| Concentration | Graduates |
|---|---|
| Other Music | 23 |
Best-Paid Careers for Music Graduates
Those who complete Music program at The University of Montana go on to a range of careers. The table below ranks the top-paying careers for Music graduates, ordered by median annual salary:
| Occupation | Nationwide Median Wage |
|---|---|
| Musicians and Singers | $96,571 |
| Disc Jockeys, Except Radio | $87,328 |
| Secondary School Teachers, Except Special and Career/Technical Education | $77,927 |
| Music Directors and Composers | $66,915 |
| Sound Engineering Technicians | $66,427 |
| Art, Drama, and Music Teachers, Postsecondary | $46,983 |
References
- IPEDS — Integrated Postsecondary Education Data System
- U.S. Department of Education — College Scorecard
- O*NET Online (Bureau of Labor Statistics)
- National Center for Education Statistics
More about our data sources and methodologies.
Course Advisor provides higher-education, college and university, degree, program, career, salary, and other helpful information to students, faculty, institutions, and other internet audiences. Presented information and data are subject to change. Inclusion on this website does not imply or represent a direct relationship with the company, school, or brand. Information, though believed correct at time of publication, may not be correct, and no warranty is provided. Contact the schools to verify any information before relying on it. Financial aid may be available for those who qualify. The displayed options may include sponsored or recommended results, not necessarily based on your preferences.
© Course Advisor – All Rights Reserved.