Fine & Studio Arts at Texas Christian University
If you are interested in studying Fine & Studio Arts, consider the program at Texas Christian University. We’ve gathered the following information to help you decide.
Texas Christian University sits in Fort Worth, TX.
For the most recent IPEDS reporting year, 16 fine & studio arts graduations were recorded at Texas Christian University.
Featured schools near , edit
Studying Online at Texas Christian University
Distance learning is available at Texas Christian University. Of 12,938 students, 318 (2%) studied exclusively online and 288 (2%) took at least some classes online.
Fine & Studio Arts Rankings at Texas Christian University
Rankings can help you compare Texas Christian University’s Fine & Studio Arts program against other schools offering the same major.
Student Demographics & Diversity
The following sections describe the composition of Fine & Studio Arts graduates at Texas Christian University, by degree type.
Across all degree levels, Fine & Studio Arts graduates at Texas Christian University are 94% women (15) and 6% men (1).
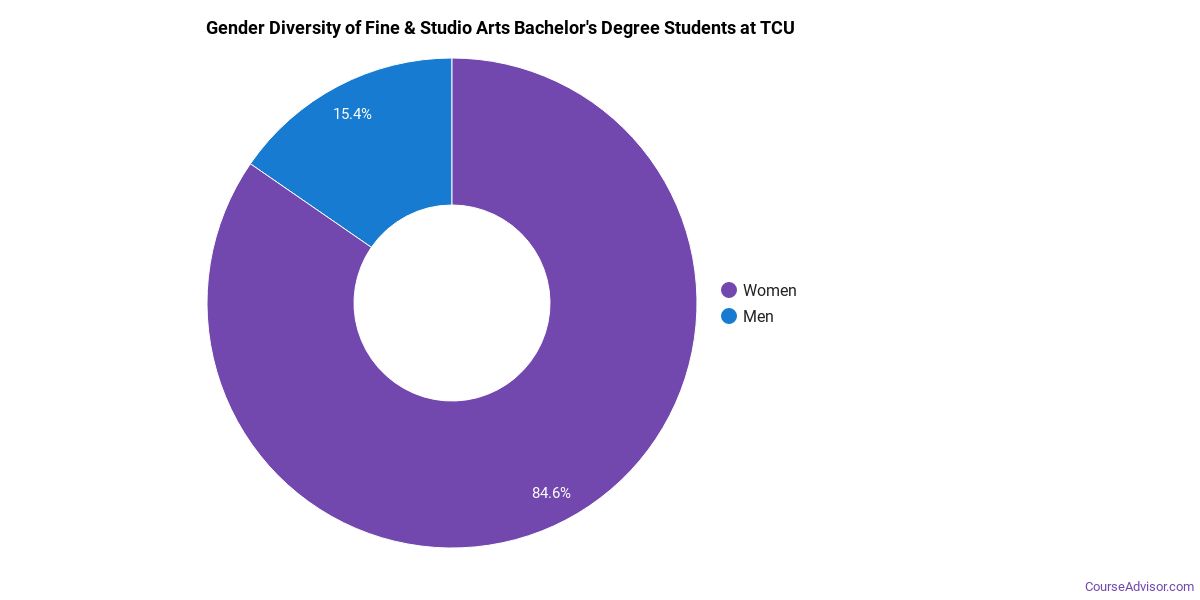
Fine & Studio Arts Bachelor’s Program at Texas Christian University
Among the 10 bachelor’s fine & studio arts degrees awarded at Texas Christian University, 90% were women (9) and 10% were men (1).
The following table and chart show the race/ethnicity of Fine & Studio Arts bachelor’s degree recipients at Texas Christian University.
| Race / Ethnicity | Number of Graduates |
|---|---|
| White | 4 |
| Hispanic / Latino | 3 |
| Black / African American | 1 |
| American Indian / Alaska Native | 1 |
| International (Nonresident) | 1 |
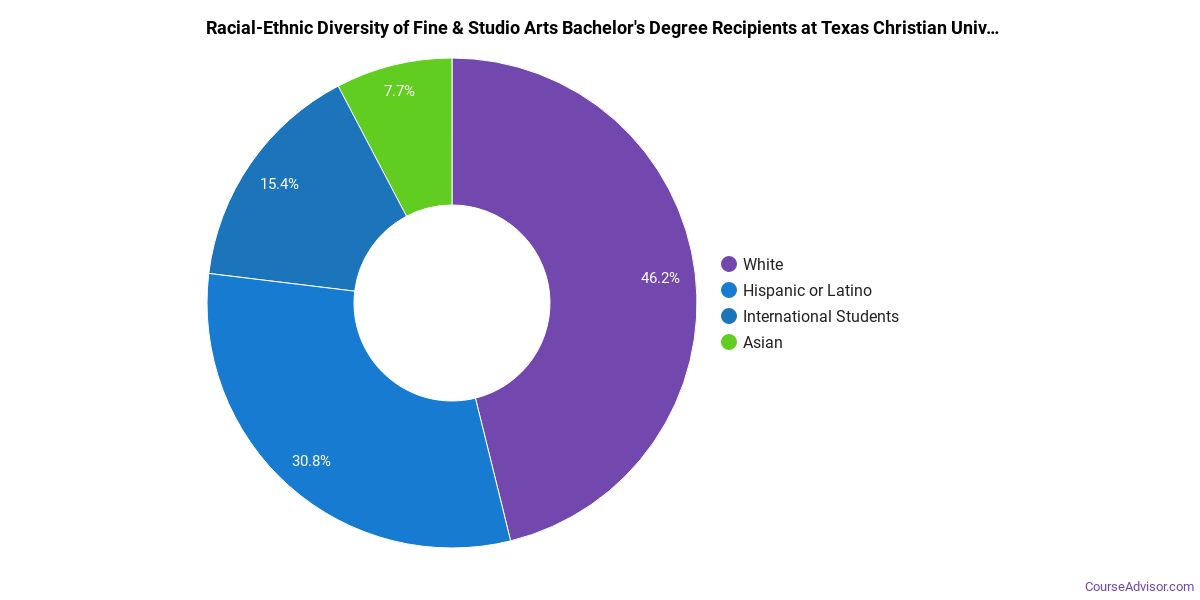
Minority students account for 50% of Fine & Studio Arts bachelor’s degree recipients at Texas Christian University, above the national average of 40%.*
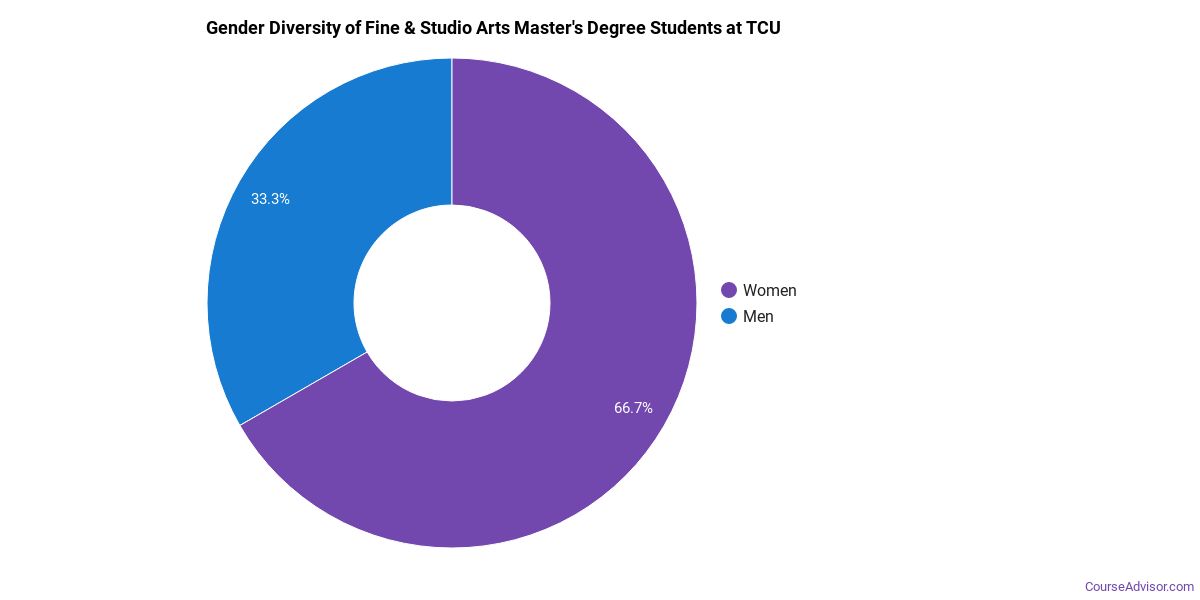
Fine & Studio Arts Master’s Program at Texas Christian University
Of the 6 master’s fine & studio arts degrees awarded at Texas Christian University, 100% were women (6) and 0% were men (0).
The following table and chart show the race/ethnicity of Fine & Studio Arts master’s degree recipients at Texas Christian University.
| Race / Ethnicity | Number of Graduates |
|---|---|
| White | 4 |
| Hispanic / Latino | 2 |
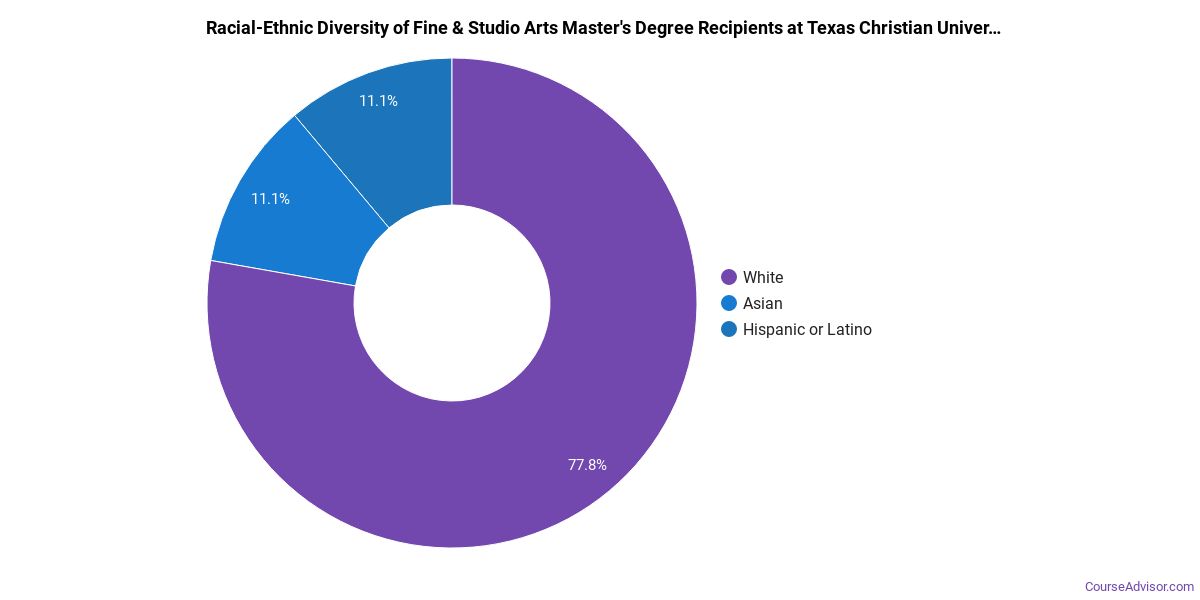
Minority students account for 33% of Fine & Studio Arts master’s degree recipients at Texas Christian University, higher than the national average of 28%.*
*The racial-ethnic minorities figure is the total number of graduates minus White, international (nonresident), and unknown-race graduates.
More Specific Fine & Studio Arts Concentrations at Texas Christian University
The Fine & Studio Arts program at Texas Christian University breaks down into more specific concentrations:
| Concentration | Graduates |
|---|---|
| Fine Arts | 3 |
| Art History | 8 |
| Intermedia/Multimedia | 1 |
| Painting | 1 |
| Sculpture | 2 |
| Ceramic Arts & Ceramics | 1 |
Highest-Paying Careers for Fine & Studio Arts Graduates
Students who finish Fine & Studio Arts program at Texas Christian University go on to a range of careers. Here are the highest-paying careers for Fine & Studio Arts graduates, ordered by median annual salary:
| Occupation | Nationwide Median Wage |
|---|---|
| Appraisers of Personal and Business Property | $118,242 |
| Art Directors | $103,285 |
| Museum Technicians and Conservators | $96,273 |
| Artists and Related Workers, All Other | $83,610 |
| Curators | $79,764 |
| Secondary School Teachers, Except Special and Career/Technical Education | $77,927 |
| Craft Artists | $76,826 |
| Photographers | $75,743 |
| Fine Artists, Including Painters, Sculptors, and Illustrators | $69,338 |
| Jewelers and Precious Stone and Metal Workers | $67,147 |
References
- IPEDS — Integrated Postsecondary Education Data System
- U.S. Department of Education — College Scorecard
- O*NET Online (Bureau of Labor Statistics)
- National Center for Education Statistics
More about our data sources and methodologies.
Course Advisor provides higher-education, college and university, degree, program, career, salary, and other helpful information to students, faculty, institutions, and other internet audiences. Presented information and data are subject to change. Inclusion on this website does not imply or represent a direct relationship with the company, school, or brand. Information, though believed correct at time of publication, may not be correct, and no warranty is provided. Contact the schools to verify any information before relying on it. Financial aid may be available for those who qualify. The displayed options may include sponsored or recommended results, not necessarily based on your preferences.
© Course Advisor – All Rights Reserved.