Tarleton State University Science & Tech Programs
Tarleton State University is a public institution located in Stephenville, TX. A Remote Town provides an ideal setting close to urban amenities.
Featured schools near , edit
Tarleton State University Rankings
Tarleton State University has earned the following rankings for science & tech programs at the bachelors level:
| Ranking | Rank | Among |
|---|---|---|
| Overall Quality | #33 of 309 | State — Texas |
| Overall Quality | #43 of 484 | Region — Southwest |
| Overall Quality | #628 of 4,630 | Nationwide |
Where Is Tarleton State University?
Contact information for Tarleton State University are given below.
| Contact Details | |
|---|---|
| Address: | 1333 W. Washington, Stephenville, TX 76401-0000 |
| Phone: | 2549689000 |
| Website: | www.tarleton.edu/ |
| Admissions: | www.tarleton.edu/admissions/ |
| Financial Aid: | www.tarleton.edu/finaid/ |
How Do I Get Into Tarleton State University?
You can apply to Tarleton State University online at: tarletonstate.force.com/undergrad/TX_SiteLogin_Undergrad?startURL=%2Fundergrad%2FTargetX_Portal__PB
Tarleton State University is classified as Least Selective (85%+) for admissions.
Admission Requirements for Tarleton State University
Here’s what Tarleton State University looks for in applicants:
| Requirement | Status |
|---|---|
| Secondary School Record | Required |
| Secondary School GPA | Required |
| Recommendations | Neither required nor recommended |
| Admission Test Scores (SAT/ACT) | Considered but not required |
How Hard Is It To Get Into Tarleton State University?
Tarleton State University admits 90%, making it highly accessible. Ensure you meet all application requirements and prepare the application in full.
Of those admitted, 24% choose to enroll — a typical enrollment-to-admission yield.
Average Test Scores
47% of admitted students submitted SAT scores and 14% submitted ACT scores.
When looking at the 25th through the 75th percentile of admitted students at Tarleton State University, SAT Evidence-Based Reading and Writing scores ranged between 500 and 590. Math scores were between 480 and 570.
Selectivity by Gender
Selectivity numbers at Tarleton State University vary modestly across gender.
| Gender | Applicants | Admitted | Acceptance Rate |
|---|---|---|---|
| Men | 5,039 | 4,339 | 86% |
| Women | 8,666 | 7,934 | 92% |
Can I Afford Tarleton State University?
The average net price after aid at Tarleton State University is $20,261. Cost varies significantly based on your financial situation since net price varies by income group.
Tuition & Fees
| Category | Cost |
|---|---|
| In-State Tuition | $4,798 |
| In-State Fees | $3,504 |
| Out-of-State Tuition | $14,638 |
| Out-of-State Fees | $3,504 |
| Total In-State Tuition & Fees | $8,302 |
| Total Out-of-State Tuition & Fees | $18,142 |
Financial Aid
Counting all forms of financial assistance, 19% of students at Tarleton State University receive some form of financial aid (2,655 students).
About 68% of students at Tarleton State University receive grant or scholarship aid, averaging $8,224 per student.
34% of students receive federal Pell Grants, averaging $6,750.
Student Loan Debt
40% of Tarleton State University undergraduates take out federal student loans, averaging $8,968 per year.
Tarleton State University Undergraduate Student Diversity
There are 2,798 students enrolled at Tarleton State University. Tarleton State University is classified as a 10,000 - 19,999 institution by enrollment size. Its Carnegie Classification is Doctoral Universities: Higher Research Activity.
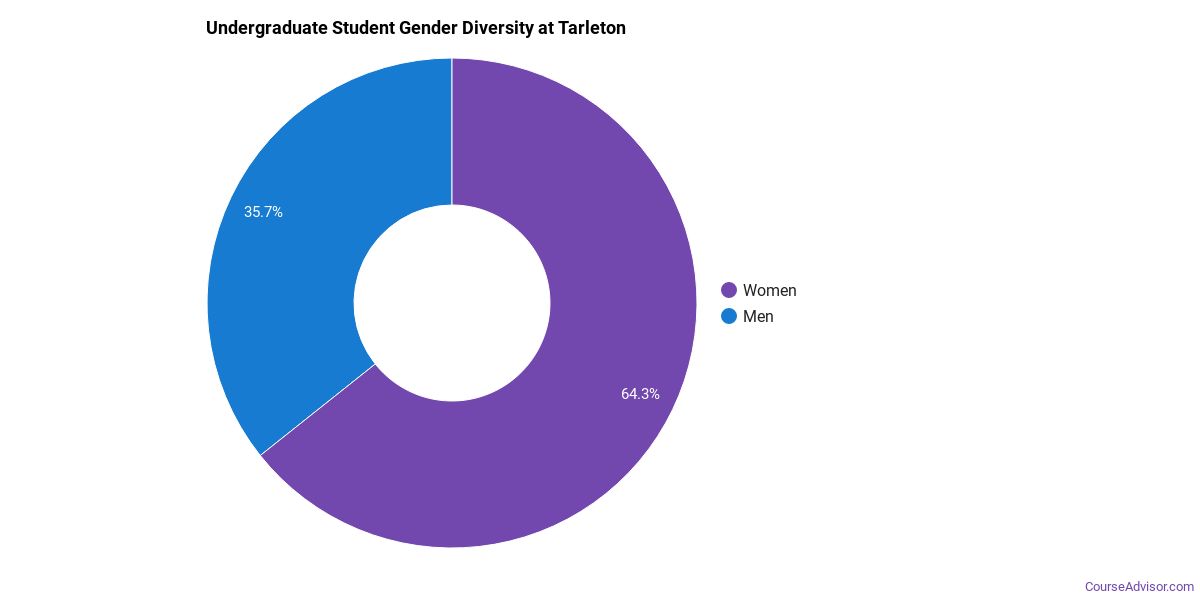
Gender Diversity
Of the 12,263 undergraduate students at Tarleton State University, approximately 39% are male and 61% are female.
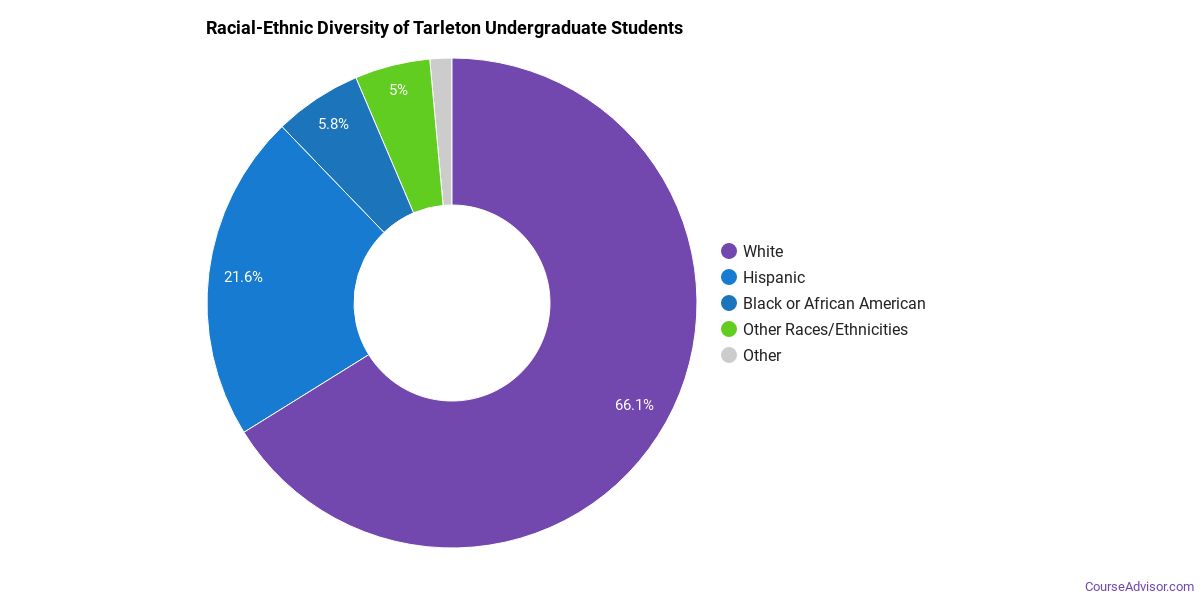
Racial-Ethnic Diversity
The racial-ethnic breakdown of Tarleton State University undergraduate students is as follows.
| Race/Ethnicity | Number of Students |
|---|---|
| Asian | 183 |
| Black or African American | 797 |
| Hispanic | 2,562 |
| White | 7,872 |
| American Indian/Alaska Native | 159 |
| Native Hawaiian/Pacific Islander | 159 |
| Two or More Races | 343 |
| Non-Resident | 61 |
Geographic Diversity
The top 5 home states of first-time undergraduate students at Tarleton State University are listed below.

| State | First-Time UG Students |
|---|---|
| Texas | 2,895 |
| California | 14 |
| Colorado | 6 |
| Florida | 6 |
| Georgia | 4 |
Additionally, approximately 0.5% of undergraduate students are non-resident from outside the United States.
Tarleton State University Graduate Student Diversity
2,249 of Tarleton State University’s students are in graduate programs. The highest graduate-level award offered is Doctor’s degree.
Gender Diversity (Graduate)
Among graduate students at Tarleton State University, approximately 33% are male and 67% are female.

Racial-Ethnic Diversity (Graduate)
The racial-ethnic breakdown of Tarleton State University graduate students is as follows.

| Race/Ethnicity | Number of Students |
|---|---|
| Asian | 38 |
| Black or African American | 294 |
| Hispanic | 474 |
| White | 1,279 |
| American Indian/Alaska Native | 24 |
| Native Hawaiian/Pacific Islander | 2 |
| Two or More Races | 62 |
| Non-Resident | 44 |
Online Learning at Tarleton State University
Tarleton State University provides online programs for students who need flexibility.
6,573 undergraduate students at Tarleton State University took at least one online class — of those, 4,970 took all of their classes online.
At the graduate level, 351 students took at least one online class and 1,433 took all classes online. Distance education is available at the undergraduate and graduate levels.
Academic Programs at Tarleton State University
Tarleton State University offers 26 distinct academic programs.
The highest level of award offered is Doctor’s degree.
Institutional Profile
Tarleton State University has an open admission policy: No. Credit transfer:
- AP credits: Yes
- Dual enrollment credits: Yes
- Life experience credits: Implied no
References
More about our data sources and methodologies.
Course Advisor provides higher-education, college and university, degree, program, career, salary, and other helpful information to students, faculty, institutions, and other internet audiences. Presented information and data are subject to change. Inclusion on this website does not imply or represent a direct relationship with the company, school, or brand. Information, though believed correct at time of publication, may not be correct, and no warranty is provided. Contact the schools to verify any information before relying on it. Financial aid may be available for those who qualify. The displayed options may include sponsored or recommended results, not necessarily based on your preferences.
© Course Advisor – All Rights Reserved.