Criminal Justice & Corrections at Springfield Technical Community College
If you plan to study Criminal Justice & Corrections, consider the program at Springfield Technical Community College. We’ve gathered the following information to help you decide.
Springfield Technical Community College is located in Springfield, MA.
In the most recent year for which we have data, 45 criminal justice & corrections graduations were recorded at Springfield Technical Community College.
Featured schools near , edit
Online Class Availability at Springfield Technical Community College
Distance learning is available at Springfield Technical Community College. Of 5,447 students, 1,877 (34%) were enrolled entirely in distance education and 2,267 (42%) took at least some classes online.
Criminal Justice & Corrections Rankings at Springfield Technical Community College
Rankings can help you compare Springfield Technical Community College’s Criminal Justice & Corrections program to other colleges that offer this major.
Associate-Level Rankings
| Ranking | Scope | Rank |
|---|---|---|
| Best Value | Massachusetts | #10 of 35 |
| Best Value | New England (Region) | #12 of 67 |
| Best Schools (Quality) | Massachusetts | #27 of 34 |
| Best Schools (Quality) | New England (Region) | #42 of 66 |
| Best Value | Nationwide | #311 of 1,206 |
| Best Schools (Quality) | Nationwide | #347 of 1,205 |
Earnings for Criminal Justice & Corrections Graduates from Springfield Technical Community College
Students who complete Springfield Technical Community College’s Criminal Justice & Corrections program report the following median earnings (per the U.S. Department of Education’s College Scorecard):

| Years After Graduation | Median Earnings |
|---|---|
| 1 year | $27,540 |
| 2 years | $29,202 |
| 3 years | $32,728 |
| 4 years | $35,355 |
| 5 years | $44,481 |
How does this compare to the school overall? Four years after graduating, Criminal Justice & Corrections graduates from Springfield Technical Community College earn a median of $35,355, compared with $47,123 for all Springfield Technical Community College graduates — about 25% lower than the school-wide median.

Median Debt at Graduation
Typical debt at graduation for Criminal Justice & Corrections graduates from Springfield Technical Community College comes in at $7,500.
Student Demographics & Diversity
The following sections describe the student demographics for Criminal Justice & Corrections graduates at Springfield Technical Community College, by degree type.
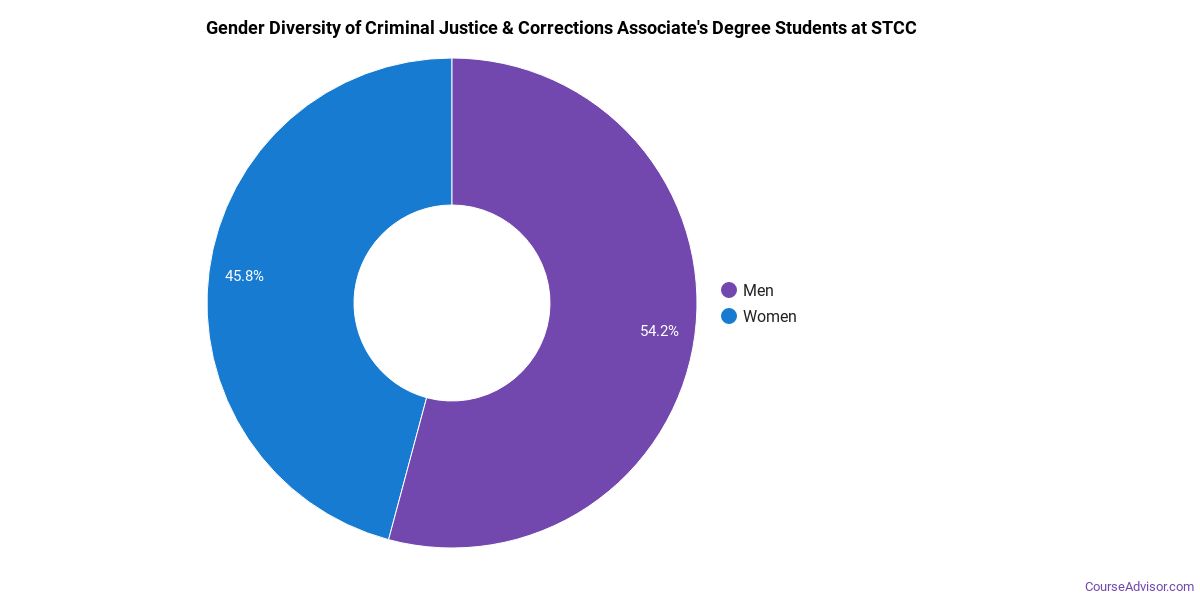
Looking at the program as a whole, Criminal Justice & Corrections graduates at Springfield Technical Community College are 62% women (28) and 38% men (17).
Criminal Justice & Corrections Associate’s Program at Springfield Technical Community College
Of the 36 associate’s criminal justice & corrections graduates at Springfield Technical Community College, 64% were women (23) and 36% were men (13).
The following table and chart show the race/ethnicity of Criminal Justice & Corrections associate’s degree recipients at Springfield Technical Community College.
| Race / Ethnicity | Number of Graduates |
|---|---|
| White | 5 |
| Hispanic / Latino | 20 |
| Black / African American | 4 |
| Asian | 2 |
| International (Nonresident) | 1 |
| Unknown | 4 |
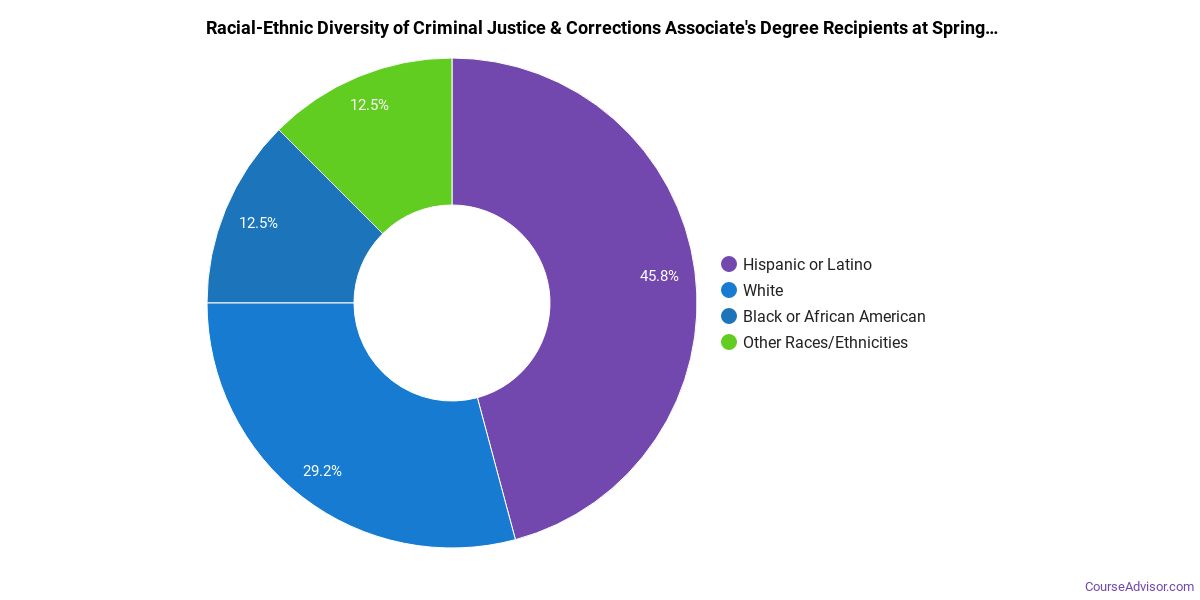
Minority students account for 72% of Criminal Justice & Corrections associate’s degree recipients at Springfield Technical Community College, above the national average of 58%.*
*The racial-ethnic minorities figure is the total number of graduates minus White, international (nonresident), and unknown-race graduates.
More Specific Criminal Justice & Corrections Concentrations at Springfield Technical Community College
This Criminal Justice & Corrections program at Springfield Technical Community College offers more specialized concentrations:
| Concentration | Graduates |
|---|---|
| Criminal Justice & Police Science | 45 |
Best-Paid Careers for Criminal Justice & Corrections Graduates
Those who complete Criminal Justice & Corrections program at Springfield Technical Community College pursue many career paths. The table below ranks the top-paying careers for Criminal Justice & Corrections graduates, ordered by median annual salary:
| Occupation | Nationwide Median Wage |
|---|---|
| Wind Energy Development Managers | $169,952 |
| Loss Prevention Managers | $165,723 |
| Wind Energy Operations Managers | $122,567 |
| Environmental Compliance Inspectors | $119,630 |
| Compliance Managers | $117,178 |
| Coroners | $110,095 |
| Brownfield Redevelopment Specialists and Site Managers | $99,321 |
| Managers, All Other | $95,684 |
| Criminal Justice and Law Enforcement Teachers, Postsecondary | $91,449 |
| Regulatory Affairs Specialists | $85,399 |
References
- IPEDS — Integrated Postsecondary Education Data System
- U.S. Department of Education — College Scorecard
- O*NET Online (Bureau of Labor Statistics)
- National Center for Education Statistics
More about our data sources and methodologies.
Course Advisor provides higher-education, college and university, degree, program, career, salary, and other helpful information to students, faculty, institutions, and other internet audiences. Presented information and data are subject to change. Inclusion on this website does not imply or represent a direct relationship with the company, school, or brand. Information, though believed correct at time of publication, may not be correct, and no warranty is provided. Contact the schools to verify any information before relying on it. Financial aid may be available for those who qualify. The displayed options may include sponsored or recommended results, not necessarily based on your preferences.
© Course Advisor – All Rights Reserved.