Music at Rollins College
What traits are you looking for in a school for Music, you may want to check out the program at Rollins College. The following information will help you decide if it is a good fit for you.
Rollins College is located in Winter Park, FL.
In the most recent year for which we have data, 27 music degrees were granted at Rollins College.
Featured schools near , edit
Studying Online at Rollins College
Rollins College primarily offers on-campus instruction; distance-education enrollment is limited.
Music Rankings at Rollins College
These rankings give you a sense of how Rollins College’s Music program to other colleges that offer this major.
Bachelor’s-Level Rankings
| Ranking | Scope | Rank |
|---|---|---|
| Best Schools (Quality) | Florida | #15 of 21 |
| Best Value | Florida | #18 of 21 |
| Best Schools (Quality) | Southeast (Region) | #67 of 99 |
| Best Value | Southeast (Region) | #93 of 99 |
| Best Schools (Quality) | Nationwide | #308 of 423 |
| Best Value | Nationwide | #386 of 421 |
Earnings for Music Graduates from Rollins College
Graduates of Rollins College’s Music program report the following median earnings (per the U.S. Department of Education’s College Scorecard):

| Years After Graduation | Median Earnings |
|---|---|
| 1 year | $18,126 |
| 3 years | $27,620 |
| 4 years | $29,384 |
| 5 years | $36,821 |
How does this compare to the school overall? Four years out, Music graduates from Rollins College report median earnings of $29,384, compared with $63,189 for all Rollins College graduates — about 53% lower than the school-wide median.

Median Debt at Graduation
Median student loan debt for Music graduates from Rollins College stands at $27,000.
Student Demographics & Diversity
Take a look at the composition of Music graduates at Rollins College, by degree type.
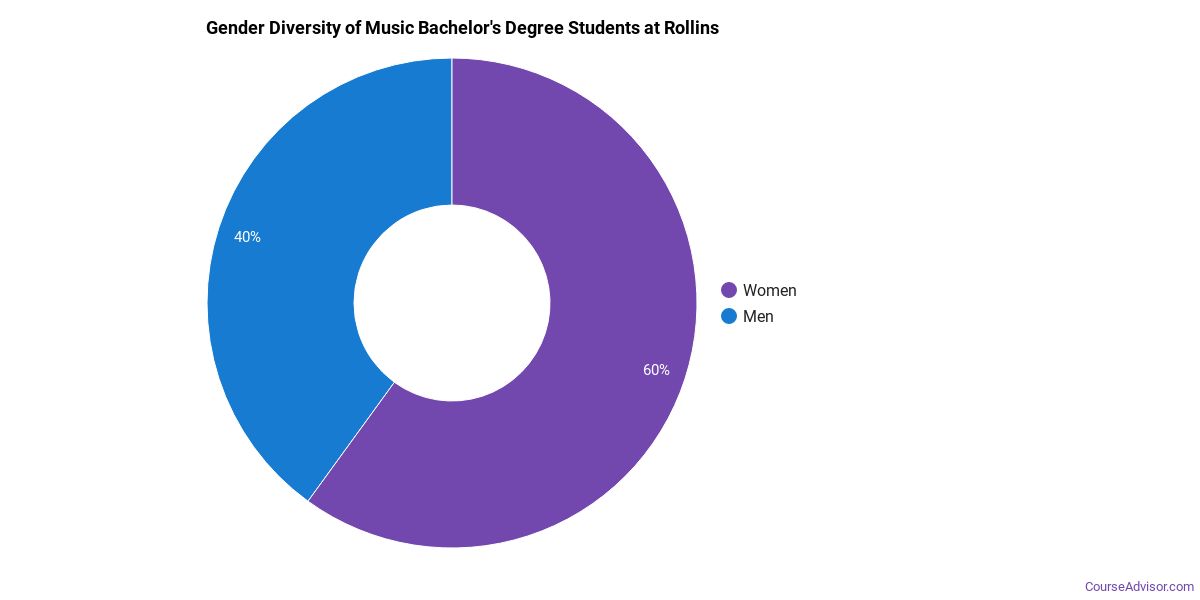
Looking at the program as a whole, Music graduates at Rollins College are 59% women (16) and 41% men (11).
Music Bachelor’s Program at Rollins College
Among the 27 bachelor’s music graduates at Rollins College, 59% were women (16) and 41% were men (11).
The following table and chart show the race/ethnicity of Music bachelor’s degree recipients at Rollins College.
| Race / Ethnicity | Number of Graduates |
|---|---|
| White | 14 |
| Hispanic / Latino | 10 |
| Black / African American | 1 |
| Asian | 1 |
| International (Nonresident) | 1 |
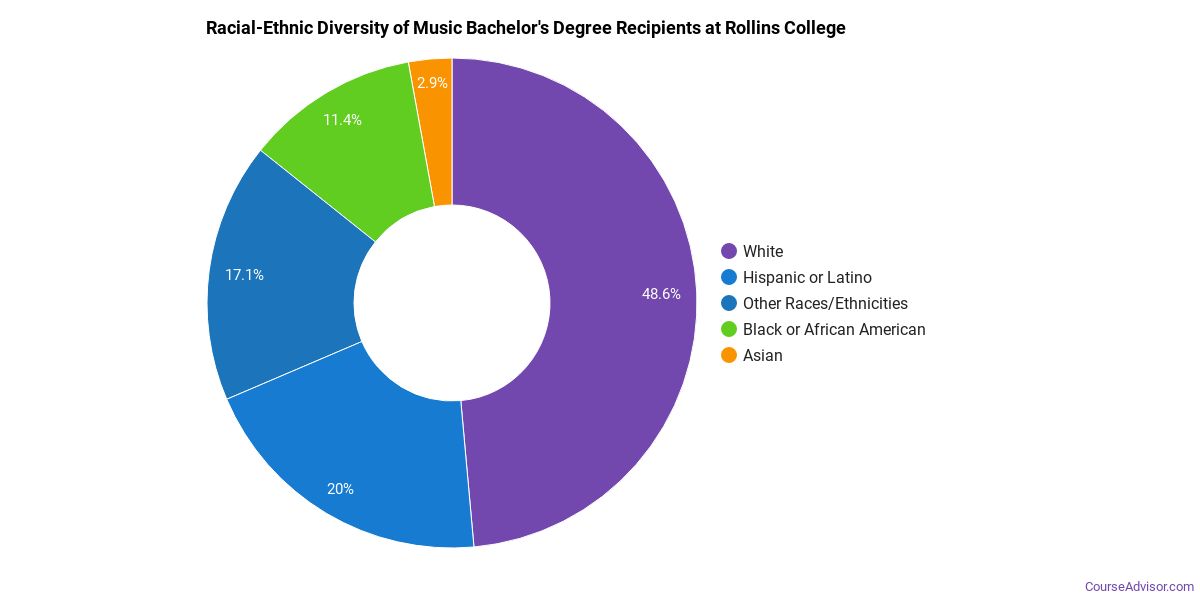
Minority students account for 44% of Music bachelor’s degree recipients at Rollins College, higher than the national average of 34%.*
*The racial-ethnic minorities figure is the total number of graduates minus White, international (nonresident), and unknown-race graduates.
More Specific Music Concentrations at Rollins College
This Music program at Rollins College offers more specialized concentrations:
| Concentration | Graduates |
|---|---|
| General Music | 27 |
Top-Paying Careers for Music Graduates
Graduates of the Music program at Rollins College work across a variety of fields. Below are the highest-paying careers for Music graduates, ordered by median annual salary:
| Occupation | Nationwide Median Wage |
|---|---|
| Musicians and Singers | $96,571 |
| Disc Jockeys, Except Radio | $87,328 |
| Secondary School Teachers, Except Special and Career/Technical Education | $77,927 |
| Music Directors and Composers | $66,915 |
| Sound Engineering Technicians | $66,427 |
| Art, Drama, and Music Teachers, Postsecondary | $46,983 |
References
- IPEDS — Integrated Postsecondary Education Data System
- U.S. Department of Education — College Scorecard
- O*NET Online (Bureau of Labor Statistics)
- National Center for Education Statistics
More about our data sources and methodologies.
Course Advisor provides higher-education, college and university, degree, program, career, salary, and other helpful information to students, faculty, institutions, and other internet audiences. Presented information and data are subject to change. Inclusion on this website does not imply or represent a direct relationship with the company, school, or brand. Information, though believed correct at time of publication, may not be correct, and no warranty is provided. Contact the schools to verify any information before relying on it. Financial aid may be available for those who qualify. The displayed options may include sponsored or recommended results, not necessarily based on your preferences.
© Course Advisor – All Rights Reserved.