Dance at Rider University
If you plan to study Dance, take a look at what Rider University. We’ve gathered the following information to help you decide.
Rider University sits in Lawrenceville, NJ.
During the most recent reporting year, 15 dance degrees were awarded at Rider University.
Featured schools near , edit
Online Class Availability at Rider University
Distance learning is available at Rider University. Of 4,003 students, 421 (11%) studied exclusively online and 1,273 (32%) took at least some classes online.
Dance Rankings at Rider University
Rankings can help you compare Rider University’s Dance program against peer institutions.
Bachelor’s-Level Rankings
| Ranking | Scope | Rank |
|---|---|---|
| Best Schools (Quality) | New Jersey | #2 of 4 |
| Best Value | New Jersey | #4 of 4 |
| Best Schools (Quality) | Middle Atlantic (Region) | #12 of 24 |
| Best Value | Middle Atlantic (Region) | #12 of 24 |
| Best Schools (Quality) | Nationwide | #52 of 97 |
| Best Value | Nationwide | #69 of 97 |
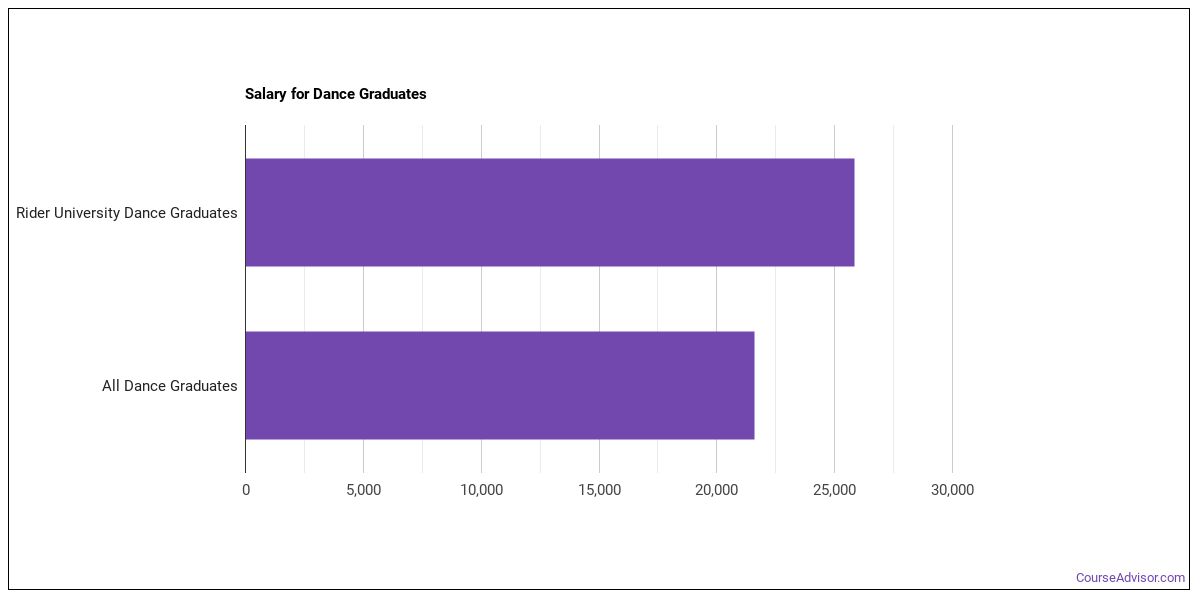
Earnings for Dance Graduates from Rider University
Graduates of Rider University’s Dance program earn the following amounts (per the U.S. Department of Education’s College Scorecard):
| Years After Graduation | Median Earnings |
|---|---|
| 1 year | $25,861 |
| 2 years | $22,329 |
| 3 years | $25,356 |
| 4 years | $28,986 |
| 5 years | $30,456 |
Is this above or below average for the school? Four years out, Dance graduates from Rider University take home a median $28,986, compared with $62,159 for all Rider University graduates — about 53% lower than the school-wide median.

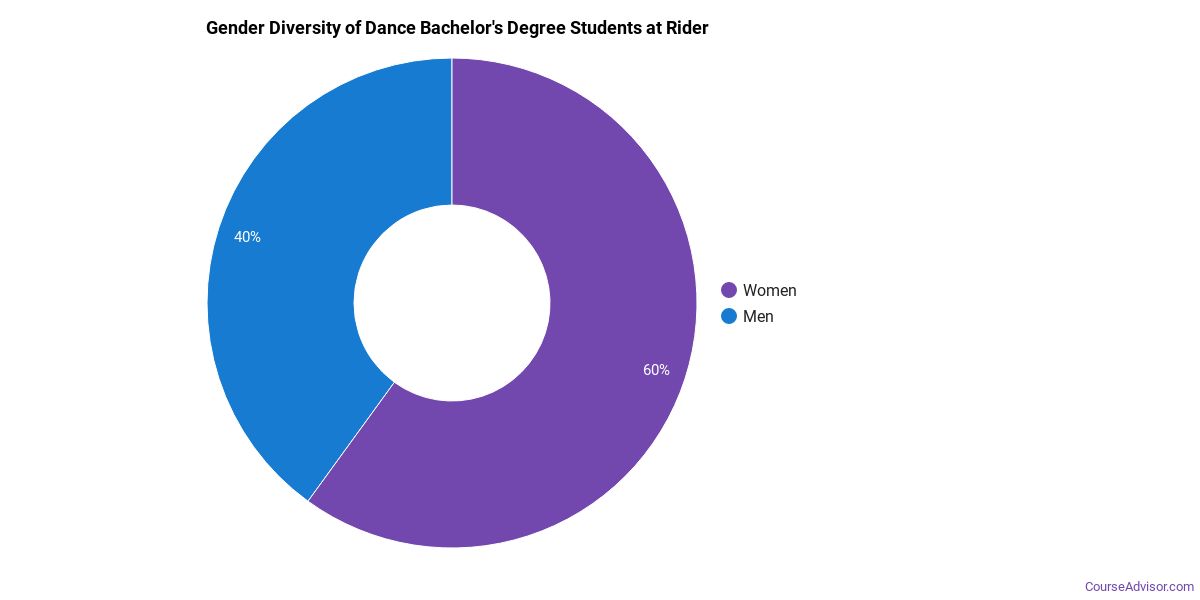
Student Demographics & Diversity
Below you’ll find the composition of Dance graduates at Rider University, by degree type.
Program-wide, Dance graduates at Rider University are 87% women (13) and 13% men (2).
Dance Bachelor’s Program at Rider University
Among the 15 bachelor’s dance degrees awarded at Rider University, 87% were women (13) and 13% were men (2).
The following table and chart show the race/ethnicity of Dance bachelor’s degree recipients at Rider University.
| Race / Ethnicity | Number of Graduates |
|---|---|
| White | 11 |
| Hispanic / Latino | 3 |
| Black / African American | 1 |
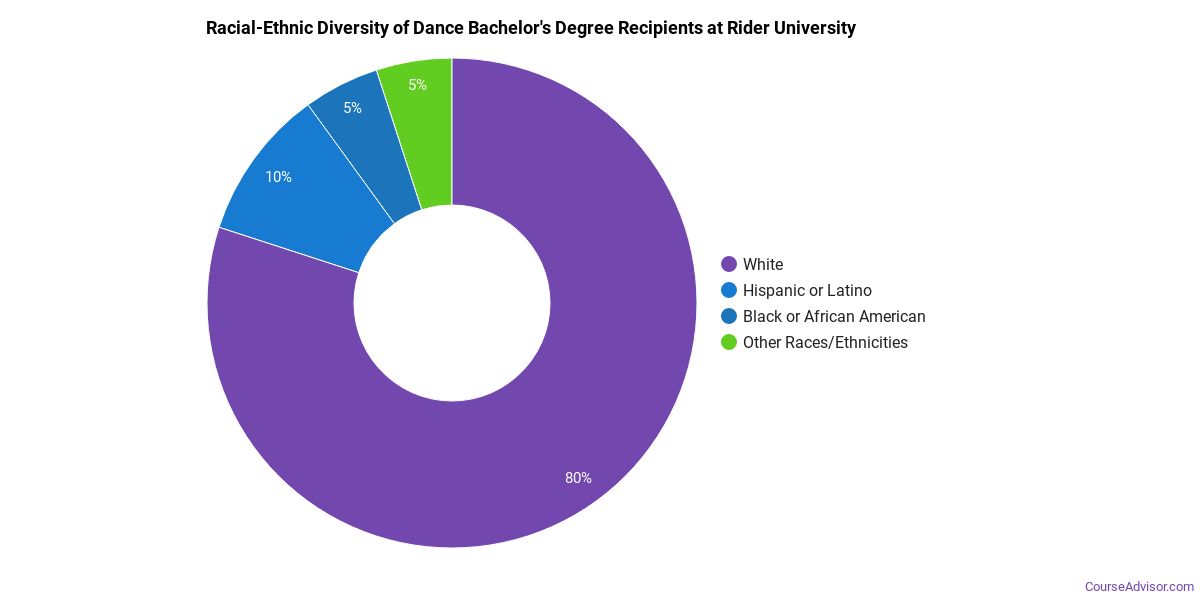
Minority students account for 27% of Dance bachelor’s degree recipients at Rider University, lower than the national average of 37%.*
*The racial-ethnic minorities figure is the total number of graduates minus White, international (nonresident), and unknown-race graduates.
More Specific Dance Concentrations at Rider University
This Dance program at Rider University includes the following sub-specializations:
| Concentration | Graduates |
|---|---|
| General Dance | 15 |
Top-Paying Careers for Dance Graduates
Graduates of the Dance program at Rider University work across a variety of fields. Here are the top-paying careers for Dance majors, ordered by median annual salary:
| Occupation | Nationwide Median Wage |
|---|---|
| Choreographers | $109,380 |
| Dancers | $74,180 |
| Art, Drama, and Music Teachers, Postsecondary | $46,983 |
References
- IPEDS — Integrated Postsecondary Education Data System
- U.S. Department of Education — College Scorecard
- O*NET Online (Bureau of Labor Statistics)
- National Center for Education Statistics
More about our data sources and methodologies.
Course Advisor provides higher-education, college and university, degree, program, career, salary, and other helpful information to students, faculty, institutions, and other internet audiences. Presented information and data are subject to change. Inclusion on this website does not imply or represent a direct relationship with the company, school, or brand. Information, though believed correct at time of publication, may not be correct, and no warranty is provided. Contact the schools to verify any information before relying on it. Financial aid may be available for those who qualify. The displayed options may include sponsored or recommended results, not necessarily based on your preferences.
© Course Advisor – All Rights Reserved.