Criminal Justice & Corrections at Quinnipiac University
If you plan to study Criminal Justice & Corrections, you may want to check out the program at Quinnipiac University. The following information will help you decide if it is a good fit for you.
Quinnipiac University is in Hamden, CT.
In the most recent year for which we have data, 38 criminal justice & corrections graduations were recorded at Quinnipiac University.
Featured schools near , edit
Online & Distance Learning at Quinnipiac University
Online coursework is an option at Quinnipiac University. Of 9,424 students, 984 (10%) were enrolled entirely in distance education and 3,168 (34%) took at least some classes online.
Criminal Justice & Corrections Rankings at Quinnipiac University
Use these rankings to compare Quinnipiac University’s Criminal Justice & Corrections program against other schools offering the same major.
Bachelor’s-Level Rankings
| Ranking | Scope | Rank |
|---|---|---|
| Best Schools (Quality) | Connecticut | #1 of 11 |
| Best Schools (Quality) | New England (Region) | #5 of 66 |
| Best Value | Connecticut | #10 of 11 |
| Best Schools (Quality) | Nationwide | #63 of 1,205 |
| Best Value | New England (Region) | #65 of 67 |
| Best Value | Nationwide | #1198 of 1,206 |
Earnings for Criminal Justice & Corrections Graduates from Quinnipiac University
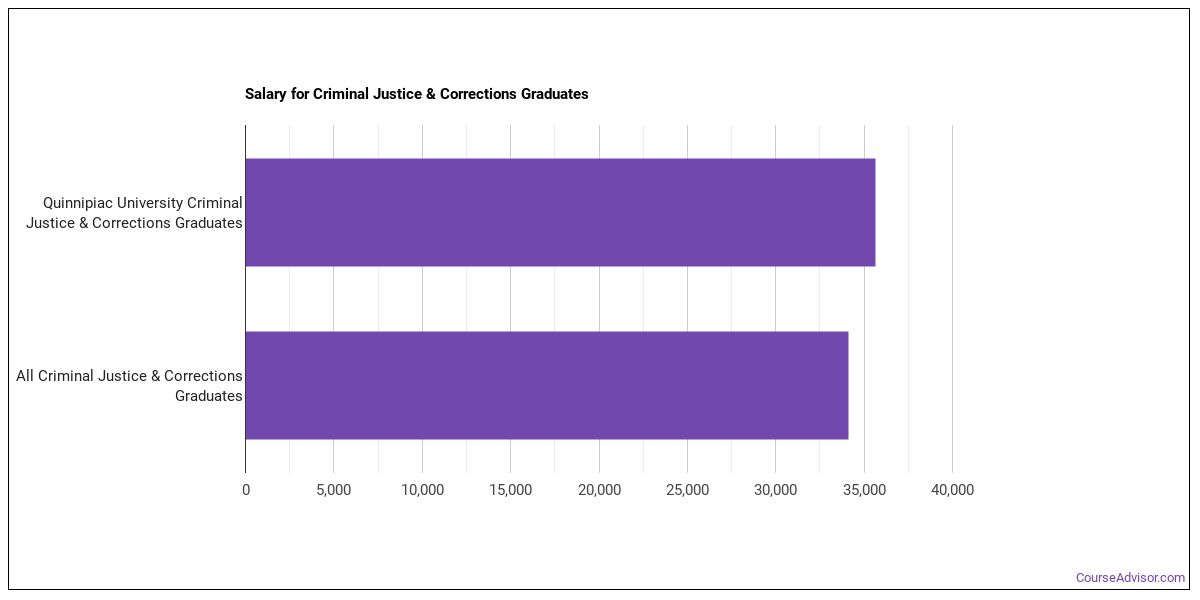
Students who complete Quinnipiac University’s Criminal Justice & Corrections program earn the following amounts (per the U.S. Department of Education’s College Scorecard):
| Years After Graduation | Median Earnings |
|---|---|
| 1 year | $35,622 |
| 2 years | $35,240 |
| 3 years | $45,724 |
| 4 years | $50,340 |
| 5 years | $66,075 |
How does this compare to the school overall? Four years after graduating, Criminal Justice & Corrections graduates from Quinnipiac University report median earnings of $50,340, compared with $76,889 for all Quinnipiac University graduates — about 35% lower than the school-wide median.

Median Debt at Graduation
Typical debt at graduation for Criminal Justice & Corrections graduates from Quinnipiac University is $27,000.
Student Demographics & Diversity
The following sections describe the student demographics for Criminal Justice & Corrections graduates at Quinnipiac University, by degree type.
Across all degree levels, Criminal Justice & Corrections graduates at Quinnipiac University are 58% women (22) and 42% men (16).
Criminal Justice & Corrections Bachelor’s Program at Quinnipiac University
Among the 38 bachelor’s criminal justice & corrections graduates at Quinnipiac University, 58% were women (22) and 42% were men (16).

The following table and chart show the race/ethnicity of Criminal Justice & Corrections bachelor’s degree recipients at Quinnipiac University.
| Race / Ethnicity | Number of Graduates |
|---|---|
| White | 28 |
| Hispanic / Latino | 5 |
| Black / African American | 3 |
| Asian | 1 |
| International (Nonresident) | 1 |
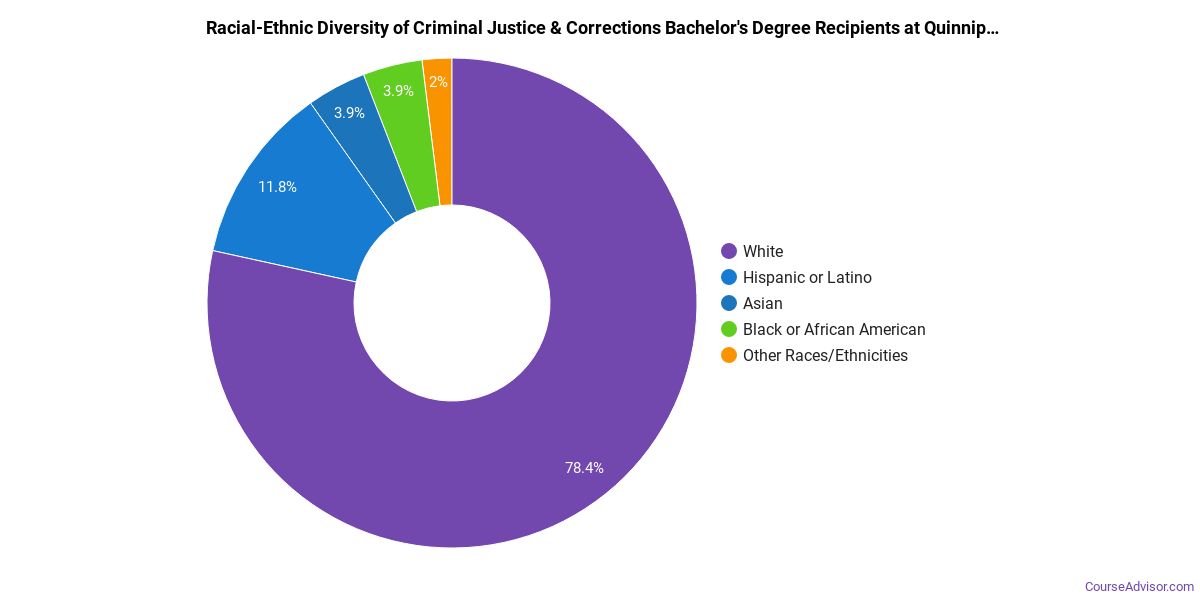
Minority students account for 24% of Criminal Justice & Corrections bachelor’s degree recipients at Quinnipiac University, below the national average of 52%.*
*The racial-ethnic minorities figure is the total number of graduates minus White, international (nonresident), and unknown-race graduates.
More Specific Criminal Justice & Corrections Concentrations at Quinnipiac University
This Criminal Justice & Corrections program at Quinnipiac University includes the following sub-specializations:
| Concentration | Graduates |
|---|---|
| Criminal Justice Studies | 38 |
Top-Paying Careers for Criminal Justice & Corrections Graduates
Students who finish Criminal Justice & Corrections program at Quinnipiac University pursue many career paths. Below are the top-paying careers for Criminal Justice & Corrections graduates, ordered by median annual salary:
| Occupation | Nationwide Median Wage |
|---|---|
| Wind Energy Development Managers | $169,952 |
| Loss Prevention Managers | $165,723 |
| Wind Energy Operations Managers | $122,567 |
| Environmental Compliance Inspectors | $119,630 |
| Compliance Managers | $117,178 |
| Coroners | $110,095 |
| Brownfield Redevelopment Specialists and Site Managers | $99,321 |
| Managers, All Other | $95,684 |
| Criminal Justice and Law Enforcement Teachers, Postsecondary | $91,449 |
| Regulatory Affairs Specialists | $85,399 |
References
- IPEDS — Integrated Postsecondary Education Data System
- U.S. Department of Education — College Scorecard
- O*NET Online (Bureau of Labor Statistics)
- National Center for Education Statistics
More about our data sources and methodologies.
Course Advisor provides higher-education, college and university, degree, program, career, salary, and other helpful information to students, faculty, institutions, and other internet audiences. Presented information and data are subject to change. Inclusion on this website does not imply or represent a direct relationship with the company, school, or brand. Information, though believed correct at time of publication, may not be correct, and no warranty is provided. Contact the schools to verify any information before relying on it. Financial aid may be available for those who qualify. The displayed options may include sponsored or recommended results, not necessarily based on your preferences.
© Course Advisor – All Rights Reserved.