Pharmacy/Pharmaceutical Sciences at Purdue University-Main Campus
If you are interested in studying Pharmacy/Pharmaceutical Sciences, consider the program at Purdue University-Main Campus. The following information will help you decide if it is a good fit for you.
Purdue University-Main Campus is located in West Lafayette, IN.
During the most recent reporting year, 228 pharmacy/pharmaceutical sciences degrees were granted at Purdue University-Main Campus.
Featured schools near , edit
Studying Online at Purdue University-Main Campus
Many students take online classes at Purdue University-Main Campus. Among 58,658 students, 4,902 (8%) studied exclusively online and 16,751 (29%) took at least some classes online.
Pharmacy/Pharmaceutical Sciences Rankings at Purdue University-Main Campus
These rankings give you a sense of how Purdue University-Main Campus’s Pharmacy/Pharmaceutical Sciences program against other schools offering the same major.
Bachelor’s-Level Rankings
| Ranking | Scope | Rank |
|---|---|---|
| Best Value | Indiana | #1 of 3 |
| Best Schools (Quality) | Indiana | #2 of 3 |
| Best Value | Great Lakes (Region) | #3 of 19 |
| Best Schools (Quality) | Great Lakes (Region) | #6 of 19 |
| Best Value | Nationwide | #16 of 121 |
| Best Schools (Quality) | Nationwide | #35 of 134 |
Master’s-Level Rankings
| Ranking | Scope | Rank |
|---|---|---|
| Best Value | Indiana | #1 of 3 |
| Best Schools (Quality) | Indiana | #2 of 3 |
| Best Value | Great Lakes (Region) | #3 of 19 |
| Best Schools (Quality) | Great Lakes (Region) | #6 of 19 |
| Best Value | Nationwide | #16 of 121 |
| Best Schools (Quality) | Nationwide | #35 of 134 |
Doctoral-Level Rankings
| Ranking | Scope | Rank |
|---|---|---|
| Best Value | Indiana | #1 of 3 |
| Best Schools (Quality) | Indiana | #2 of 3 |
| Best Value | Great Lakes (Region) | #3 of 19 |
| Best Schools (Quality) | Great Lakes (Region) | #6 of 19 |
| Best Value | Nationwide | #16 of 121 |
| Best Schools (Quality) | Nationwide | #35 of 134 |
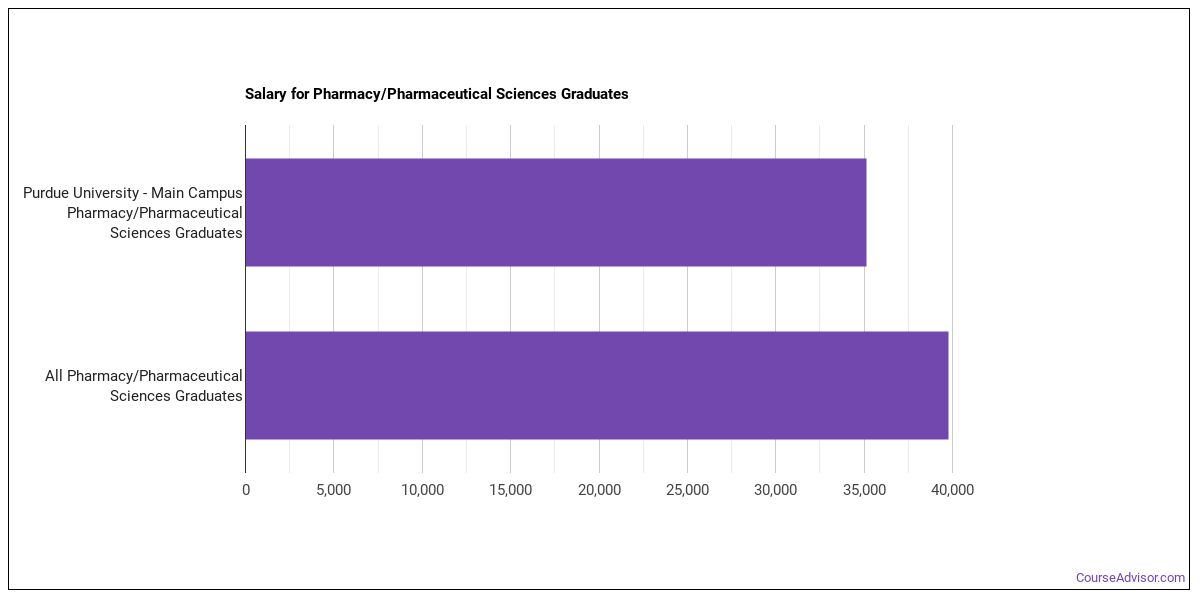
Earnings for Pharmacy/Pharmaceutical Sciences Graduates from Purdue University-Main Campus
Graduates of Purdue University-Main Campus’s Pharmacy/Pharmaceutical Sciences program report the following median earnings (per the U.S. Department of Education’s College Scorecard):
| Years After Graduation | Median Earnings |
|---|---|
| 1 year | $71,023 |
| 2 years | $90,942 |
| 3 years | $123,756 |
| 4 years | $132,000 |
| 5 years | $143,079 |
How does this compare to the school overall? Four years out, Pharmacy/Pharmaceutical Sciences graduates from Purdue University-Main Campus take home a median $132,000, compared with $79,539 for all Purdue University-Main Campus graduates — about 66% higher than the school-wide median.

Median Debt at Graduation
The median debt for Pharmacy/Pharmaceutical Sciences graduates from Purdue University-Main Campus comes in at $19,046.
Student Demographics & Diversity
Below you’ll find the composition of Pharmacy/Pharmaceutical Sciences graduates at Purdue University-Main Campus, by degree type.
Across all degree levels, Pharmacy/Pharmaceutical Sciences graduates at Purdue University-Main Campus are 64% women (146) and 36% men (82).
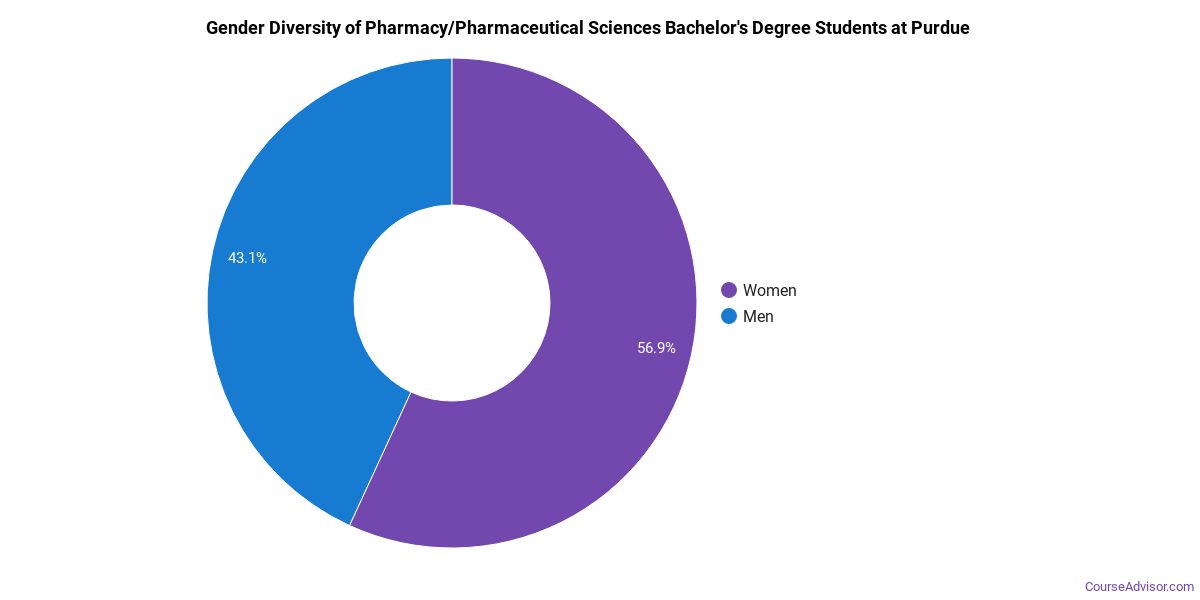
Pharmacy/Pharmaceutical Sciences Bachelor’s Program at Purdue University-Main Campus
Among the 59 bachelor’s pharmacy/pharmaceutical sciences degrees awarded at Purdue University-Main Campus, 64% were women (38) and 36% were men (21).
The following table and chart show the race/ethnicity of Pharmacy/Pharmaceutical Sciences bachelor’s degree recipients at Purdue University-Main Campus.
| Race / Ethnicity | Number of Graduates |
|---|---|
| White | 27 |
| Black / African American | 2 |
| Asian | 13 |
| Two or More Races | 4 |
| International (Nonresident) | 11 |
| Unknown | 2 |
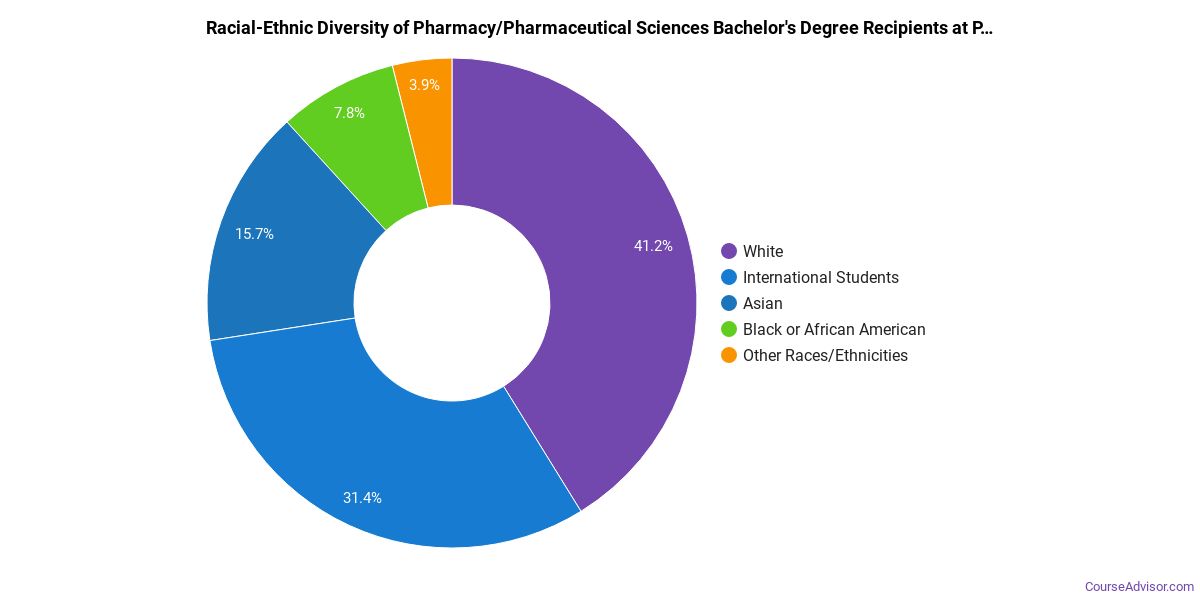
Minority students account for 32% of Pharmacy/Pharmaceutical Sciences bachelor’s degree recipients at Purdue University-Main Campus, lower than the national average of 40%.*
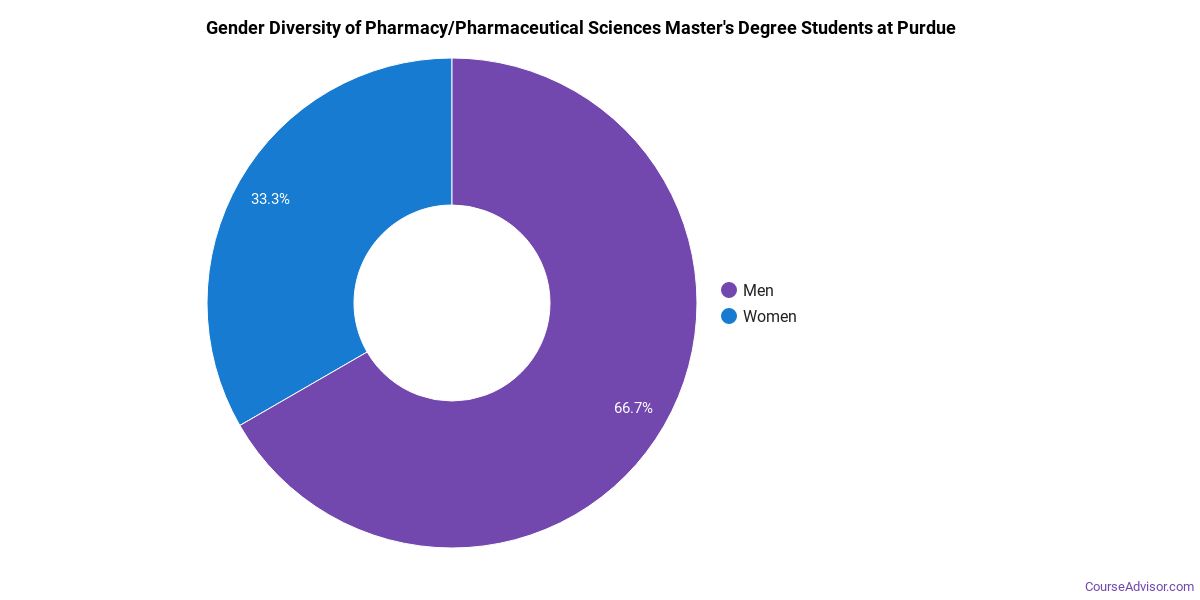
Pharmacy/Pharmaceutical Sciences Master’s Program at Purdue University-Main Campus
Among the 4 master’s pharmacy/pharmaceutical sciences graduates at Purdue University-Main Campus, 100% were women (4) and 0% were men (0).
The following table and chart show the race/ethnicity of Pharmacy/Pharmaceutical Sciences master’s degree recipients at Purdue University-Main Campus.
| Race / Ethnicity | Number of Graduates |
|---|---|
| Hispanic / Latino | 1 |
| International (Nonresident) | 1 |
| Unknown | 2 |
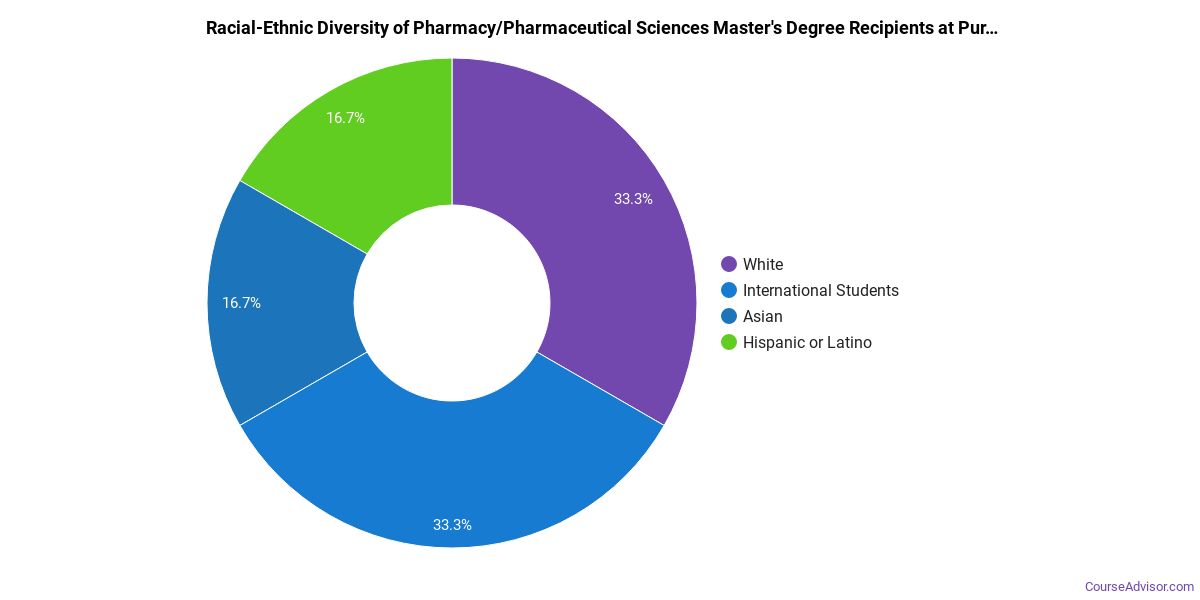
Minority students account for 25% of Pharmacy/Pharmaceutical Sciences master’s degree recipients at Purdue University-Main Campus, above the national average of 23%.*
Pharmacy/Pharmaceutical Sciences Doctoral Program at Purdue University-Main Campus
Among the 22 doctoral pharmacy/pharmaceutical sciences degrees awarded at Purdue University-Main Campus, 50% were women (11) and 50% were men (11).

The following table and chart show the race/ethnicity of Pharmacy/Pharmaceutical Sciences doctoral degree recipients at Purdue University-Main Campus.
| Race / Ethnicity | Number of Graduates |
|---|---|
| White | 7 |
| Black / African American | 1 |
| Two or More Races | 2 |
| International (Nonresident) | 12 |

Racial-ethnic minorities make up 14% of Pharmacy/Pharmaceutical Sciences doctoral degree recipients at Purdue University-Main Campus, lower than the national average of 24%.*
*The racial-ethnic minorities figure is the total number of graduates minus White, international (nonresident), and unknown-race graduates.
More Specific Pharmacy/Pharmaceutical Sciences Concentrations at Purdue University-Main Campus
The Pharmacy/Pharmaceutical Sciences program at Purdue University-Main Campus breaks down into more specific concentrations:
| Concentration | Graduates |
|---|---|
| Pharmacy | 136 |
| Pharmaceutics & Drug Design | 68 |
| Medicinal & Pharmaceutical Chemistry | 14 |
| Pharmaceutical Sciences | 10 |
Best-Paid Careers for Pharmacy/Pharmaceutical Sciences Graduates
Students who finish Pharmacy/Pharmaceutical Sciences program at Purdue University-Main Campus go on to a range of careers. Here are the top-paying careers for Pharmacy/Pharmaceutical Sciences majors, ordered by median annual salary:
| Occupation | Nationwide Median Wage |
|---|---|
| Water Resource Specialists | $179,716 |
| Wind Energy Development Managers | $169,952 |
| Loss Prevention Managers | $165,723 |
| Biofuels Production Managers | $164,096 |
| Geothermal Production Managers | $160,381 |
| Biomass Power Plant Managers | $146,025 |
| Natural Sciences Managers | $132,227 |
| Medical and Health Services Managers | $129,557 |
| Industrial Production Managers | $126,666 |
| Wind Energy Operations Managers | $122,567 |
References
- IPEDS — Integrated Postsecondary Education Data System
- U.S. Department of Education — College Scorecard
- O*NET Online (Bureau of Labor Statistics)
- National Center for Education Statistics
More about our data sources and methodologies.
Course Advisor provides higher-education, college and university, degree, program, career, salary, and other helpful information to students, faculty, institutions, and other internet audiences. Presented information and data are subject to change. Inclusion on this website does not imply or represent a direct relationship with the company, school, or brand. Information, though believed correct at time of publication, may not be correct, and no warranty is provided. Contact the schools to verify any information before relying on it. Financial aid may be available for those who qualify. The displayed options may include sponsored or recommended results, not necessarily based on your preferences.
© Course Advisor – All Rights Reserved.