Computational Science at Pennsylvania State University-Penn State Great Valley
If you plan to study Computational Science, you may want to check out the program at Pennsylvania State University-Penn State Great Valley. We’ve gathered the following information to help you decide.
Pennsylvania State University-Penn State Great Valley sits in Malvern, PA.
During the most recent reporting year, 34 computational science degrees were granted at Pennsylvania State University-Penn State Great Valley.
Featured schools near , edit
Online Class Availability at Pennsylvania State University-Penn State Great Valley
Many students take online classes at Pennsylvania State University-Penn State Great Valley. Of 212 students, 9 (4%) studied exclusively online and 33 (16%) took at least some classes online.
Student Demographics & Diversity
Below you’ll find the composition of Computational Science graduates at Pennsylvania State University-Penn State Great Valley, by degree type.
Looking at the program as a whole, Computational Science graduates at Pennsylvania State University-Penn State Great Valley are 29% women (10) and 71% men (24).
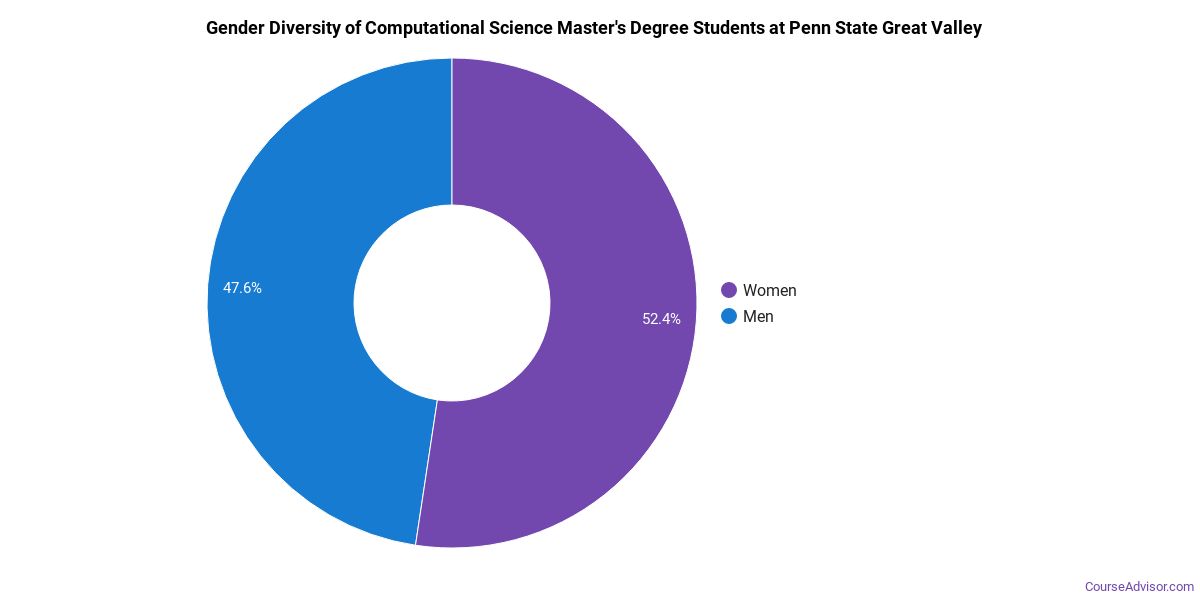
Computational Science Master’s Program at Pennsylvania State University-Penn State Great Valley
Among the 28 master’s computational science graduates at Pennsylvania State University-Penn State Great Valley, 32% were women (9) and 68% were men (19).
The following table and chart show the race/ethnicity of Computational Science master’s degree recipients at Pennsylvania State University-Penn State Great Valley.
| Race / Ethnicity | Number of Graduates |
|---|---|
| White | 4 |
| Asian | 1 |
| International (Nonresident) | 23 |
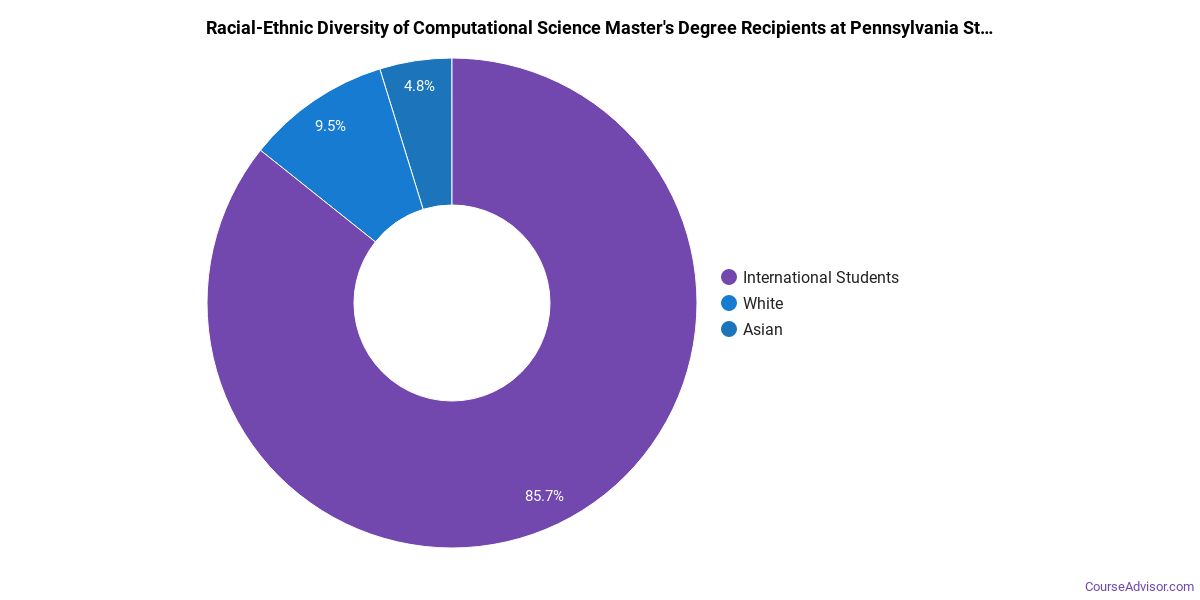
Minority students account for 4% of Computational Science master’s degree recipients at Pennsylvania State University-Penn State Great Valley, lower than the national average of 14%.*
*The racial-ethnic minorities figure is the total number of graduates minus White, international (nonresident), and unknown-race graduates.
More Specific Computational Science Concentrations at Pennsylvania State University-Penn State Great Valley
This Computational Science program at Pennsylvania State University-Penn State Great Valley offers more specialized concentrations:
| Concentration | Graduates |
|---|---|
| Computational Science | 34 |
Best-Paid Careers for Computational Science Graduates
Those who complete Computational Science program at Pennsylvania State University-Penn State Great Valley go on to a range of careers. Below are the highest-paying careers for Computational Science majors, ordered by median annual salary:
| Occupation | Nationwide Median Wage |
|---|---|
| Water Resource Specialists | $179,716 |
| Computer Occupations, All Other | $159,837 |
| Document Management Specialists | $147,490 |
| Business Intelligence Analysts | $143,840 |
| Information Security Engineers | $142,543 |
| Computer Systems Engineers/Architects | $140,795 |
| Natural Sciences Managers | $132,227 |
| Information Technology Project Managers | $124,655 |
| Blockchain Engineers | $123,667 |
| Bioinformatics Technicians | $121,896 |
References
- IPEDS — Integrated Postsecondary Education Data System
- U.S. Department of Education — College Scorecard
- O*NET Online (Bureau of Labor Statistics)
- National Center for Education Statistics
More about our data sources and methodologies.
Course Advisor provides higher-education, college and university, degree, program, career, salary, and other helpful information to students, faculty, institutions, and other internet audiences. Presented information and data are subject to change. Inclusion on this website does not imply or represent a direct relationship with the company, school, or brand. Information, though believed correct at time of publication, may not be correct, and no warranty is provided. Contact the schools to verify any information before relying on it. Financial aid may be available for those who qualify. The displayed options may include sponsored or recommended results, not necessarily based on your preferences.
© Course Advisor – All Rights Reserved.