Mental & Social Health Services at Northern Kentucky University
What traits are you looking for in a school for Mental & Social Health Services, consider the program at Northern Kentucky University. We’ve gathered the following information to help you decide.
Northern Kentucky University sits in Highland Heights, KY.
For the most recent IPEDS reporting year, 23 mental & social health services degrees were granted at Northern Kentucky University.
Featured schools near , edit
Online Class Availability at Northern Kentucky University
Online coursework is an option at Northern Kentucky University. Of 15,347 students, 6,624 (43%) studied exclusively online and 4,682 (31%) took at least some classes online.
Mental & Social Health Services Rankings at Northern Kentucky University
Rankings can help you compare Northern Kentucky University’s Mental & Social Health Services program against other schools offering the same major.
Bachelor’s-Level Rankings
| Ranking | Scope | Rank |
|---|---|---|
| Best Value | Kentucky | #2 of 9 |
| Best Schools (Quality) | Kentucky | #3 of 9 |
| Best Value | Southeast (Region) | #28 of 116 |
| Best Schools (Quality) | Southeast (Region) | #52 of 110 |
| Best Value | Nationwide | #98 of 514 |
| Best Schools (Quality) | Nationwide | #351 of 530 |
Master’s-Level Rankings
| Ranking | Scope | Rank |
|---|---|---|
| Best Value | Kentucky | #2 of 9 |
| Best Schools (Quality) | Kentucky | #3 of 9 |
| Best Value | Southeast (Region) | #28 of 116 |
| Best Schools (Quality) | Southeast (Region) | #52 of 110 |
| Best Value | Nationwide | #98 of 514 |
| Best Schools (Quality) | Nationwide | #351 of 530 |
Earnings for Mental & Social Health Services Graduates from Northern Kentucky University
Those who finish Northern Kentucky University’s Mental & Social Health Services program earn at the following median levels (per the U.S. Department of Education’s College Scorecard):

| Years After Graduation | Median Earnings |
|---|---|
| 2 years | $38,000 |
| 3 years | $46,734 |
| 4 years | $48,372 |
| 5 years | $47,132 |
How does this compare to the school overall? Four years out, Mental & Social Health Services graduates from Northern Kentucky University report median earnings of $48,372, compared with $63,438 for all Northern Kentucky University graduates — about 24% lower than the school-wide median.

Student Demographics & Diversity
Below you’ll find the diversity of Mental & Social Health Services graduates at Northern Kentucky University, broken down by degree level.
Across all degree levels, Mental & Social Health Services graduates at Northern Kentucky University are 83% women (19) and 17% men (4).
Mental & Social Health Services Bachelor’s Program at Northern Kentucky University
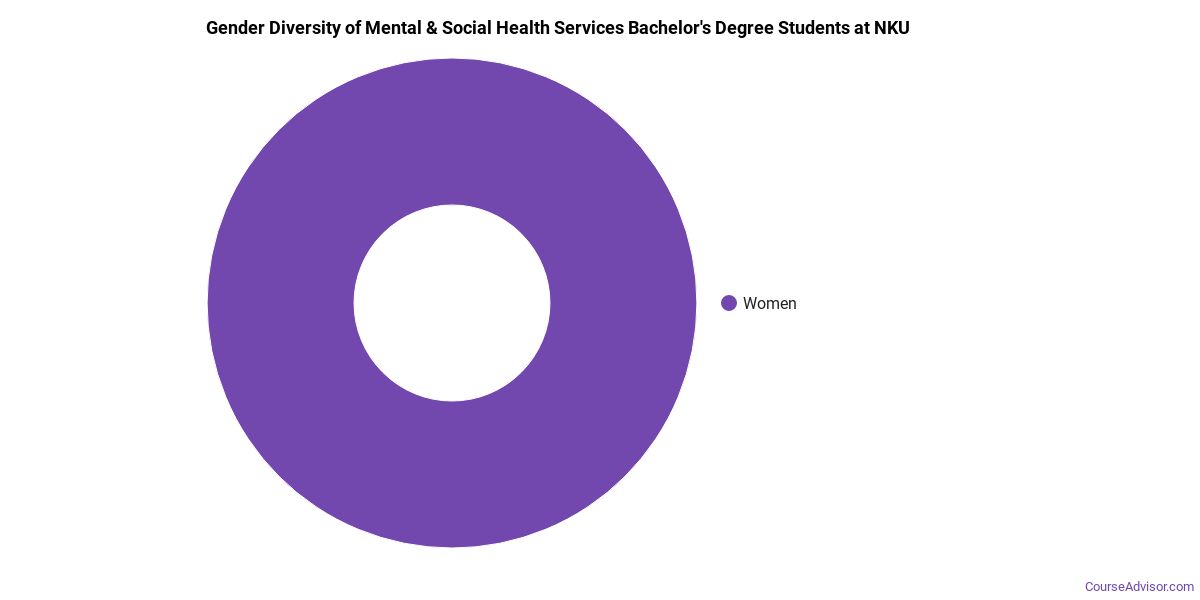
Among the 8 bachelor’s mental & social health services degrees awarded at Northern Kentucky University, 75% were women (6) and 25% were men (2).
The following table and chart show the race/ethnicity of Mental & Social Health Services bachelor’s degree recipients at Northern Kentucky University.
| Race / Ethnicity | Number of Graduates |
|---|---|
| White | 6 |
| Hispanic / Latino | 2 |
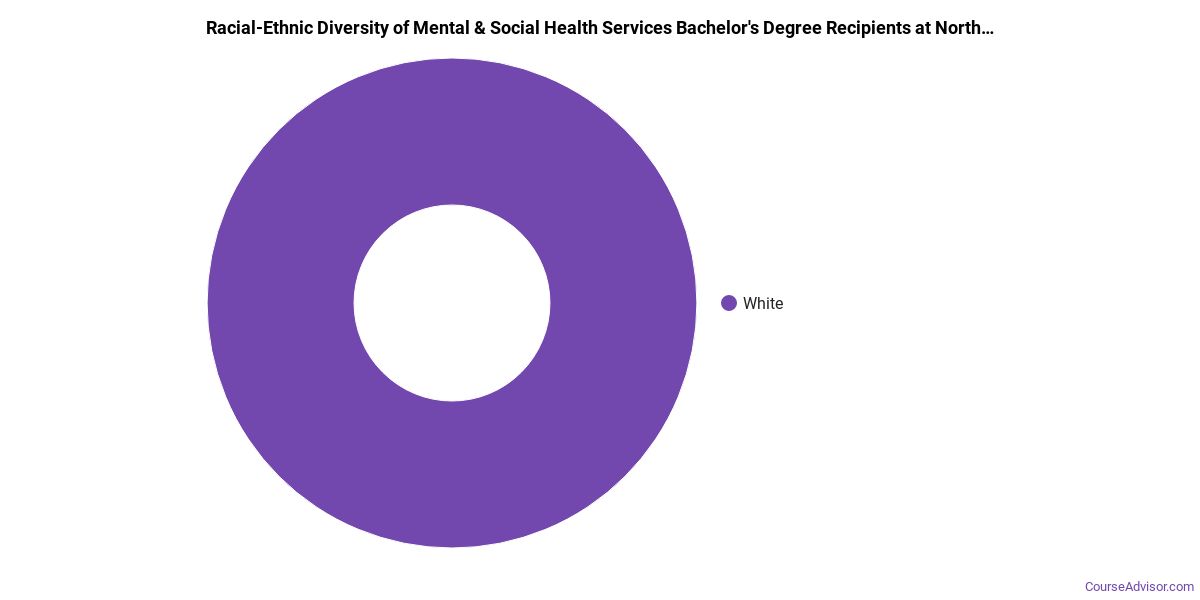
Racial-ethnic minorities make up 25% of Mental & Social Health Services bachelor’s degree recipients at Northern Kentucky University, below the national average of 41%.*
Mental & Social Health Services Master’s Program at Northern Kentucky University
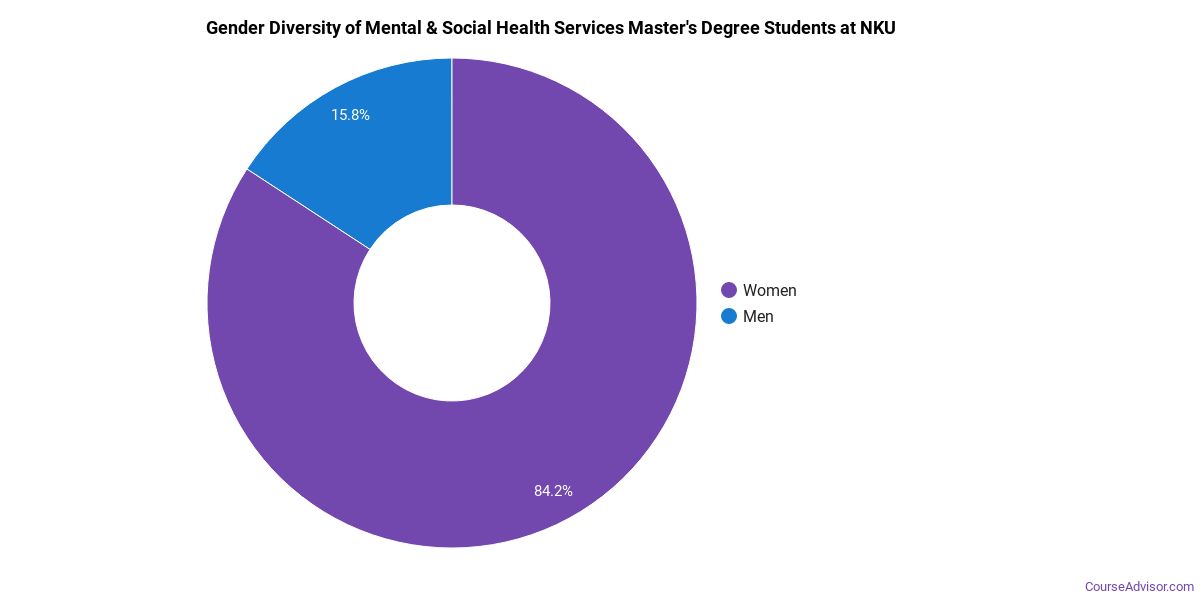
Of the 15 master’s mental & social health services graduates at Northern Kentucky University, 87% were women (13) and 13% were men (2).
The following table and chart show the race/ethnicity of Mental & Social Health Services master’s degree recipients at Northern Kentucky University.
| Race / Ethnicity | Number of Graduates |
|---|---|
| White | 13 |
| Black / African American | 1 |
| Asian | 1 |
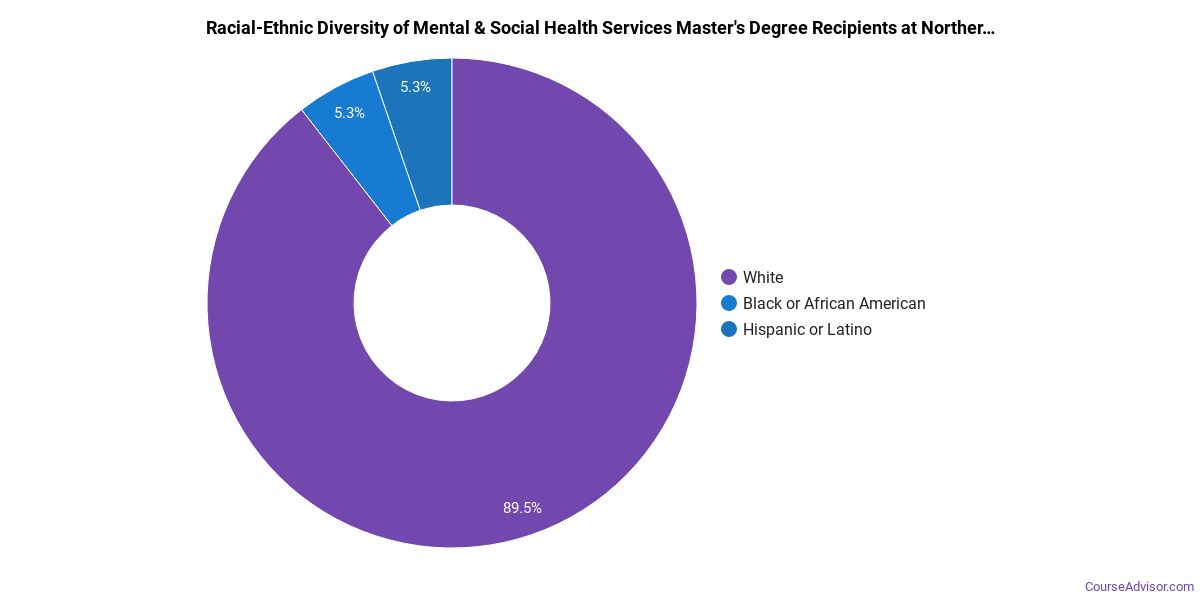
Racial-ethnic minorities make up 13% of Mental & Social Health Services master’s degree recipients at Northern Kentucky University, lower than the national average of 37%.*
*The racial-ethnic minorities figure is the total number of graduates minus White, international (nonresident), and unknown-race graduates.
More Specific Mental & Social Health Services Concentrations at Northern Kentucky University
The Mental & Social Health Services program at Northern Kentucky University includes the following sub-specializations:
| Concentration | Graduates |
|---|---|
| Mental Health Counseling | 15 |
| Other Mental Health Services | 8 |
Best-Paid Careers for Mental & Social Health Services Graduates
Graduates of the Mental & Social Health Services program at Northern Kentucky University go on to a range of careers. Here are the best-paid careers for Mental & Social Health Services graduates, ordered by median annual salary:
| Occupation | Nationwide Median Wage |
|---|---|
| Psychology Teachers, Postsecondary | $98,479 |
| Counselors, All Other | $81,766 |
| Health Education Specialists | $81,726 |
| Healthcare Social Workers | $78,044 |
| Marriage and Family Therapists | $74,325 |
| Community Health Workers | $73,901 |
| Mental Health Counselors | $72,983 |
| Clinical and Counseling Psychologists | $68,140 |
| Social Work Teachers, Postsecondary | $65,510 |
| Directors, Religious Activities and Education | $64,599 |
References
- IPEDS — Integrated Postsecondary Education Data System
- U.S. Department of Education — College Scorecard
- O*NET Online (Bureau of Labor Statistics)
- National Center for Education Statistics
More about our data sources and methodologies.
Course Advisor provides higher-education, college and university, degree, program, career, salary, and other helpful information to students, faculty, institutions, and other internet audiences. Presented information and data are subject to change. Inclusion on this website does not imply or represent a direct relationship with the company, school, or brand. Information, though believed correct at time of publication, may not be correct, and no warranty is provided. Contact the schools to verify any information before relying on it. Financial aid may be available for those who qualify. The displayed options may include sponsored or recommended results, not necessarily based on your preferences.
© Course Advisor – All Rights Reserved.