Mental & Social Health Services at New Mexico State University-Main Campus
If you plan to study Mental & Social Health Services, you may want to check out the program at New Mexico State University-Main Campus. The following information will help you decide if it is a good fit for you.
New Mexico State University-Main Campus is located in Las Cruces, NM.
In the most recent year for which we have data, 28 mental & social health services degrees were granted at New Mexico State University-Main Campus.
Featured schools near , edit
Online Class Availability at New Mexico State University-Main Campus
Many students take online classes at New Mexico State University-Main Campus. Of 15,408 students, 3,649 (24%) studied exclusively online and 6,713 (44%) took at least some classes online.
Mental & Social Health Services Rankings at New Mexico State University-Main Campus
These rankings give you a sense of how New Mexico State University-Main Campus’s Mental & Social Health Services program against peer institutions.
Bachelor’s-Level Rankings
| Ranking | Scope | Rank |
|---|---|---|
| Best Value | New Mexico | #2 of 6 |
| Best Schools (Quality) | New Mexico | #3 of 6 |
| Best Value | Southwest (Region) | #16 of 58 |
| Best Schools (Quality) | Southwest (Region) | #37 of 62 |
| Best Value | Nationwide | #90 of 514 |
| Best Schools (Quality) | Nationwide | #352 of 530 |
Master’s-Level Rankings
| Ranking | Scope | Rank |
|---|---|---|
| Best Value | New Mexico | #2 of 6 |
| Best Schools (Quality) | New Mexico | #3 of 6 |
| Best Value | Southwest (Region) | #16 of 58 |
| Best Schools (Quality) | Southwest (Region) | #37 of 62 |
| Best Value | Nationwide | #90 of 514 |
| Best Schools (Quality) | Nationwide | #352 of 530 |
Median Debt at Graduation
The median debt for Mental & Social Health Services graduates from New Mexico State University-Main Campus comes in at $24,421.
Student Demographics & Diversity
The following sections describe the composition of Mental & Social Health Services graduates at New Mexico State University-Main Campus, broken down by degree level.
Across all degree levels, Mental & Social Health Services graduates at New Mexico State University-Main Campus are 89% women (25) and 11% men (3).
Mental & Social Health Services Bachelor’s Program at New Mexico State University-Main Campus
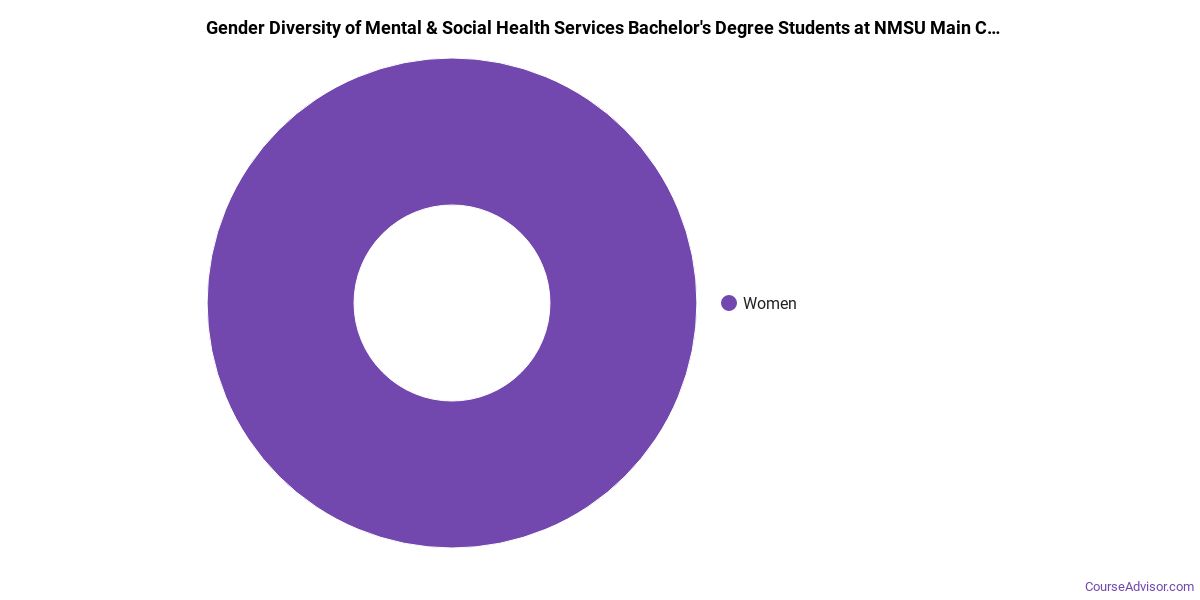
Of the 18 bachelor’s mental & social health services graduates at New Mexico State University-Main Campus, 83% were women (15) and 17% were men (3).
The following table and chart show the race/ethnicity of Mental & Social Health Services bachelor’s degree recipients at New Mexico State University-Main Campus.
| Race / Ethnicity | Number of Graduates |
|---|---|
| White | 3 |
| Hispanic / Latino | 13 |
| American Indian / Alaska Native | 1 |
| Two or More Races | 1 |
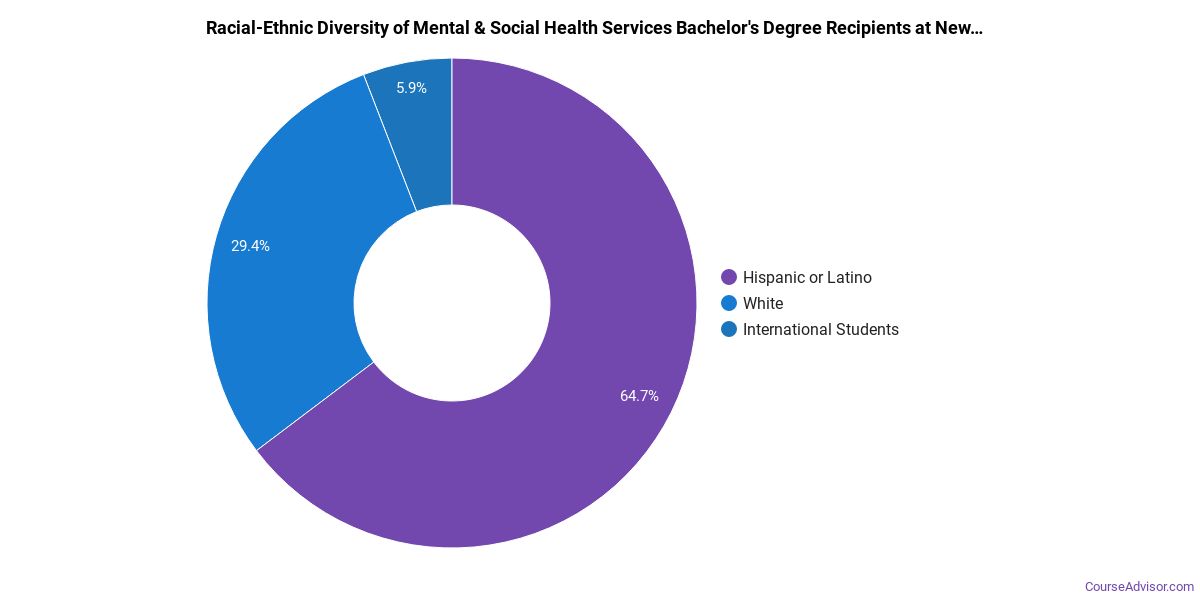
Racial-ethnic minorities make up 83% of Mental & Social Health Services bachelor’s degree recipients at New Mexico State University-Main Campus, higher than the national average of 41%.*
Mental & Social Health Services Master’s Program at New Mexico State University-Main Campus
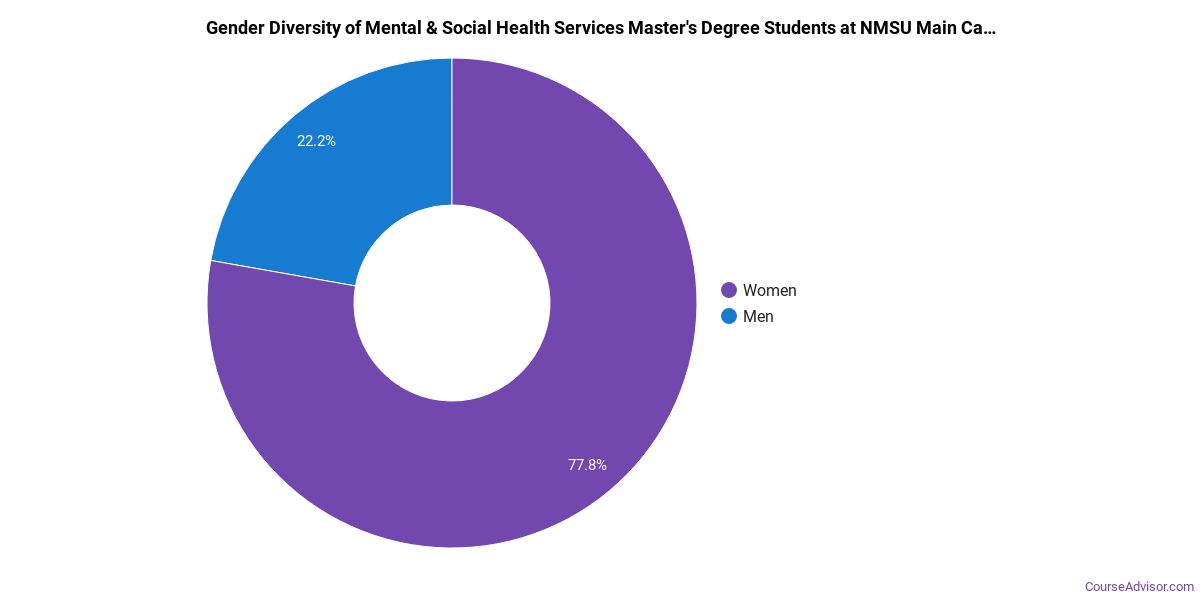
Of the 10 master’s mental & social health services graduates at New Mexico State University-Main Campus, 100% were women (10) and 0% were men (0).
The following table and chart show the race/ethnicity of Mental & Social Health Services master’s degree recipients at New Mexico State University-Main Campus.
| Race / Ethnicity | Number of Graduates |
|---|---|
| White | 3 |
| Hispanic / Latino | 4 |
| Black / African American | 1 |
| American Indian / Alaska Native | 1 |
| International (Nonresident) | 1 |
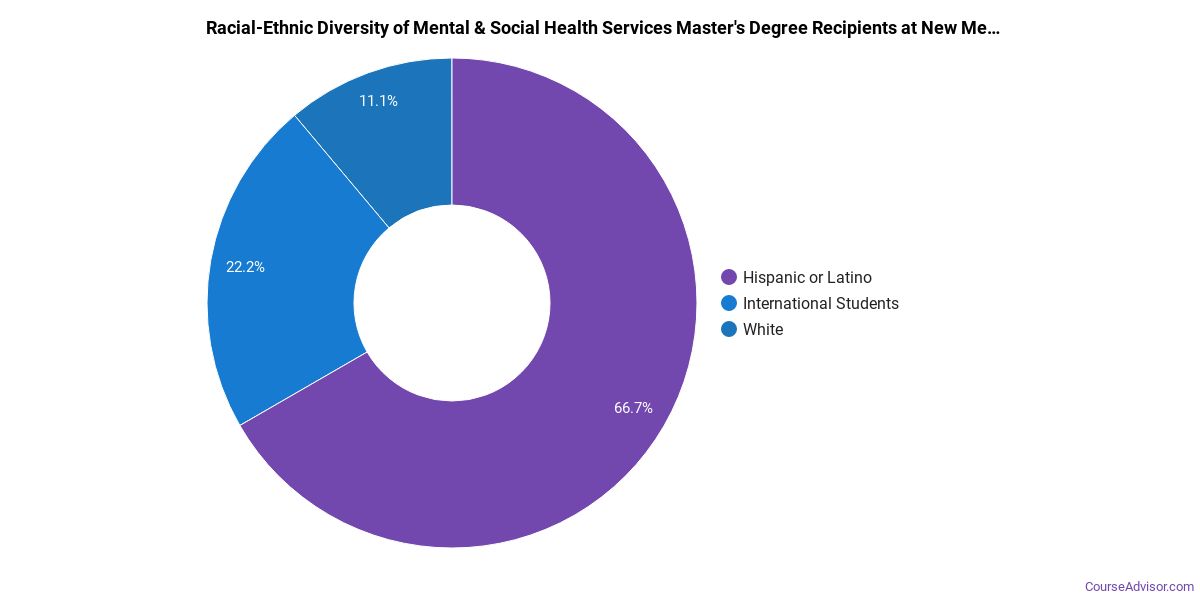
Racial-ethnic minorities make up 60% of Mental & Social Health Services master’s degree recipients at New Mexico State University-Main Campus, higher than the national average of 37%.*
*The racial-ethnic minorities figure is the total number of graduates minus White, international (nonresident), and unknown-race graduates.
More Specific Mental & Social Health Services Concentrations at New Mexico State University-Main Campus
This Mental & Social Health Services program at New Mexico State University-Main Campus breaks down into more specific concentrations:
| Concentration | Graduates |
|---|---|
| Community Health Services/Counseling | 18 |
| Mental Health Counseling | 10 |
Best-Paid Careers for Mental & Social Health Services Graduates
Those who complete Mental & Social Health Services program at New Mexico State University-Main Campus go on to a range of careers. Here are the top-paying careers for Mental & Social Health Services majors, ordered by median annual salary:
| Occupation | Nationwide Median Wage |
|---|---|
| Psychology Teachers, Postsecondary | $98,479 |
| Counselors, All Other | $81,766 |
| Health Education Specialists | $81,726 |
| Healthcare Social Workers | $78,044 |
| Marriage and Family Therapists | $74,325 |
| Community Health Workers | $73,901 |
| Mental Health Counselors | $72,983 |
| Clinical and Counseling Psychologists | $68,140 |
| Social Work Teachers, Postsecondary | $65,510 |
| Directors, Religious Activities and Education | $64,599 |
References
- IPEDS — Integrated Postsecondary Education Data System
- U.S. Department of Education — College Scorecard
- O*NET Online (Bureau of Labor Statistics)
- National Center for Education Statistics
More about our data sources and methodologies.
Course Advisor provides higher-education, college and university, degree, program, career, salary, and other helpful information to students, faculty, institutions, and other internet audiences. Presented information and data are subject to change. Inclusion on this website does not imply or represent a direct relationship with the company, school, or brand. Information, though believed correct at time of publication, may not be correct, and no warranty is provided. Contact the schools to verify any information before relying on it. Financial aid may be available for those who qualify. The displayed options may include sponsored or recommended results, not necessarily based on your preferences.
© Course Advisor – All Rights Reserved.