Dance at Montclair State University
If you are interested in studying Dance, you may want to check out the program at Montclair State University. Get started with the following essential facts.
Montclair State University sits in Montclair, NJ.
For the most recent IPEDS reporting year, 41 dance degrees were awarded at Montclair State University.
Featured schools near , edit
Studying Online at Montclair State University
Many students take online classes at Montclair State University. Among 23,375 students, 2,063 (9%) were enrolled entirely in distance education and 10,593 (45%) took at least some classes online.
Dance Rankings at Montclair State University
Use these rankings to compare Montclair State University’s Dance program to other colleges that offer this major.
Bachelor’s-Level Rankings
| Ranking | Scope | Rank |
|---|---|---|
| Best Value | New Jersey | #2 of 4 |
| Best Schools (Quality) | New Jersey | #4 of 4 |
| Best Value | Middle Atlantic (Region) | #6 of 24 |
| Best Schools (Quality) | Middle Atlantic (Region) | #17 of 24 |
| Best Value | Nationwide | #32 of 97 |
| Best Schools (Quality) | Nationwide | #67 of 97 |
Master’s-Level Rankings
| Ranking | Scope | Rank |
|---|---|---|
| Best Value | New Jersey | #2 of 4 |
| Best Schools (Quality) | New Jersey | #4 of 4 |
| Best Value | Middle Atlantic (Region) | #6 of 24 |
| Best Schools (Quality) | Middle Atlantic (Region) | #17 of 24 |
| Best Value | Nationwide | #32 of 97 |
| Best Schools (Quality) | Nationwide | #67 of 97 |
Earnings for Dance Graduates from Montclair State University
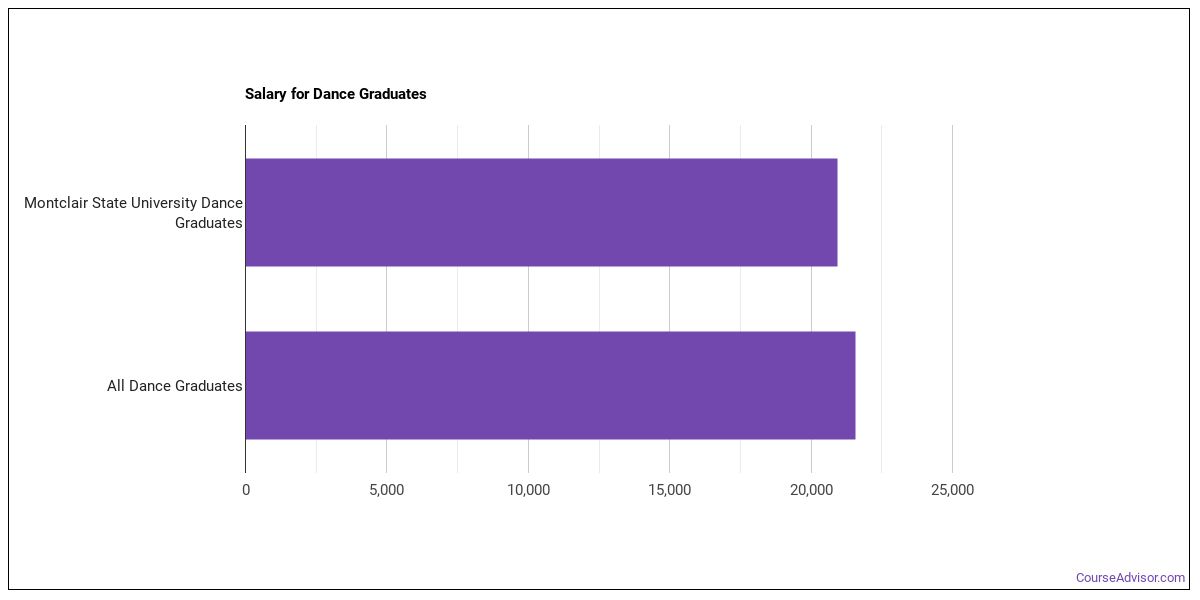
Those who finish Montclair State University’s Dance program report the following median earnings (per the U.S. Department of Education’s College Scorecard):
| Years After Graduation | Median Earnings |
|---|---|
| 1 year | $20,947 |
| 4 years | $19,128 |
| 5 years | $27,863 |
How do these earnings stack up against the rest of the school? At the four-year mark, Dance graduates from Montclair State University report median earnings of $19,128, compared with $59,350 for all Montclair State University graduates — about 68% lower than the school-wide median.

Median Debt at Graduation
The median debt for Dance graduates from Montclair State University stands at $27,000.
Student Demographics & Diversity
The following sections describe the composition of Dance graduates at Montclair State University, broken down by degree level.
Looking at the program as a whole, Dance graduates at Montclair State University are 85% women (35) and 15% men (6).
Dance Bachelor’s Program at Montclair State University
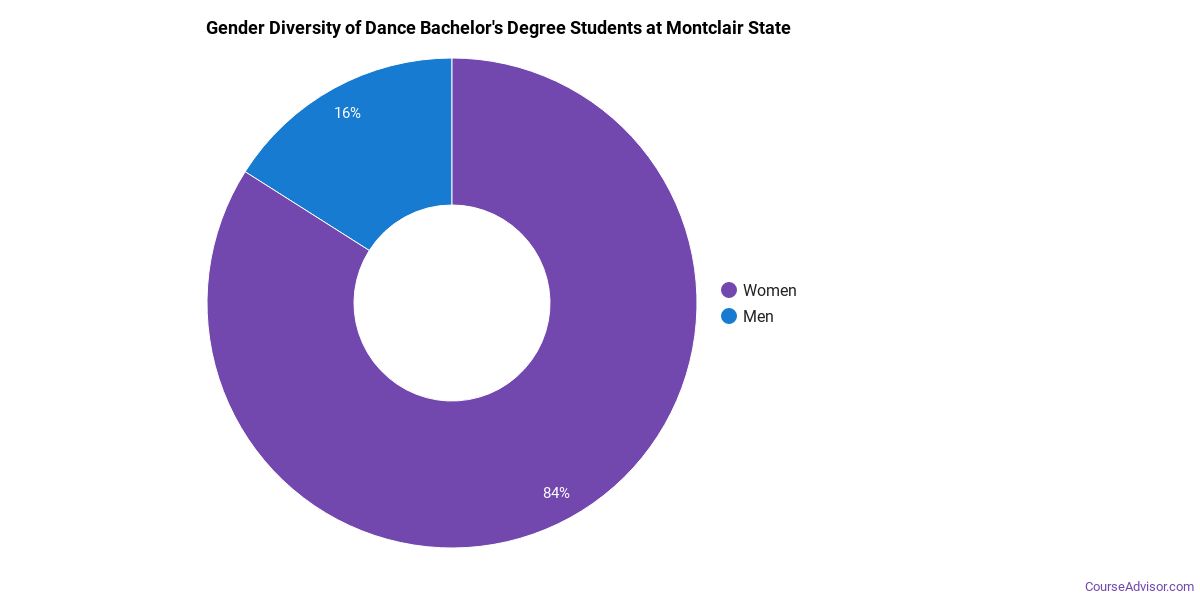
Among the 33 bachelor’s dance graduates at Montclair State University, 85% were women (28) and 15% were men (5).
The following table and chart show the race/ethnicity of Dance bachelor’s degree recipients at Montclair State University.
| Race / Ethnicity | Number of Graduates |
|---|---|
| White | 10 |
| Hispanic / Latino | 8 |
| Black / African American | 8 |
| Asian | 1 |
| Two or More Races | 4 |
| Unknown | 2 |
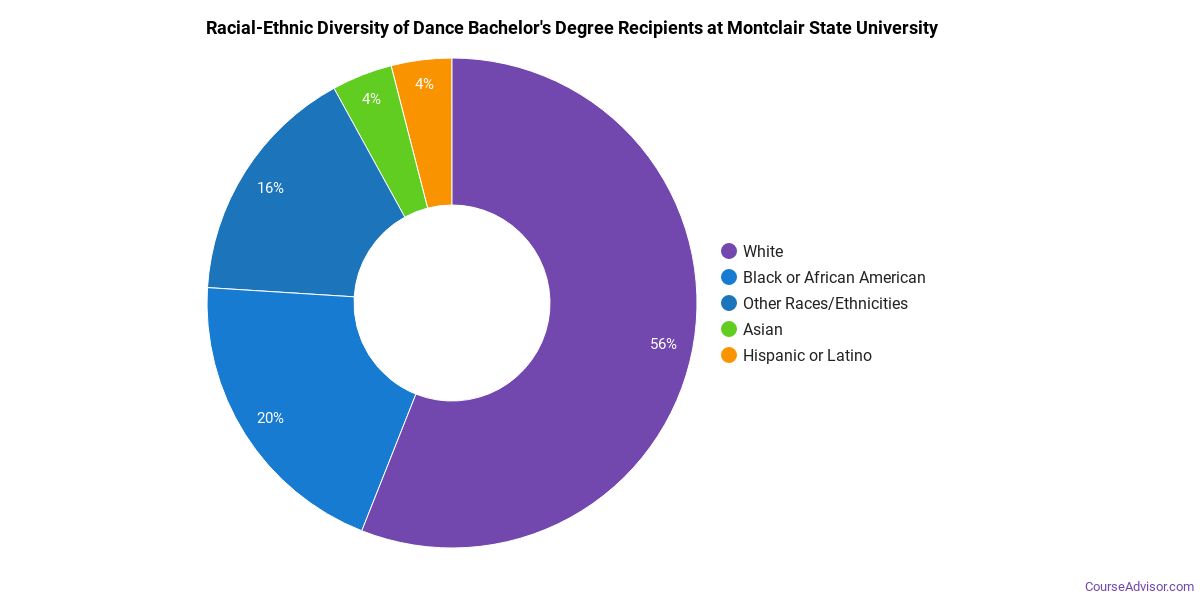
Minority students account for 64% of Dance bachelor’s degree recipients at Montclair State University, higher than the national average of 37%.*
Dance Master’s Program at Montclair State University
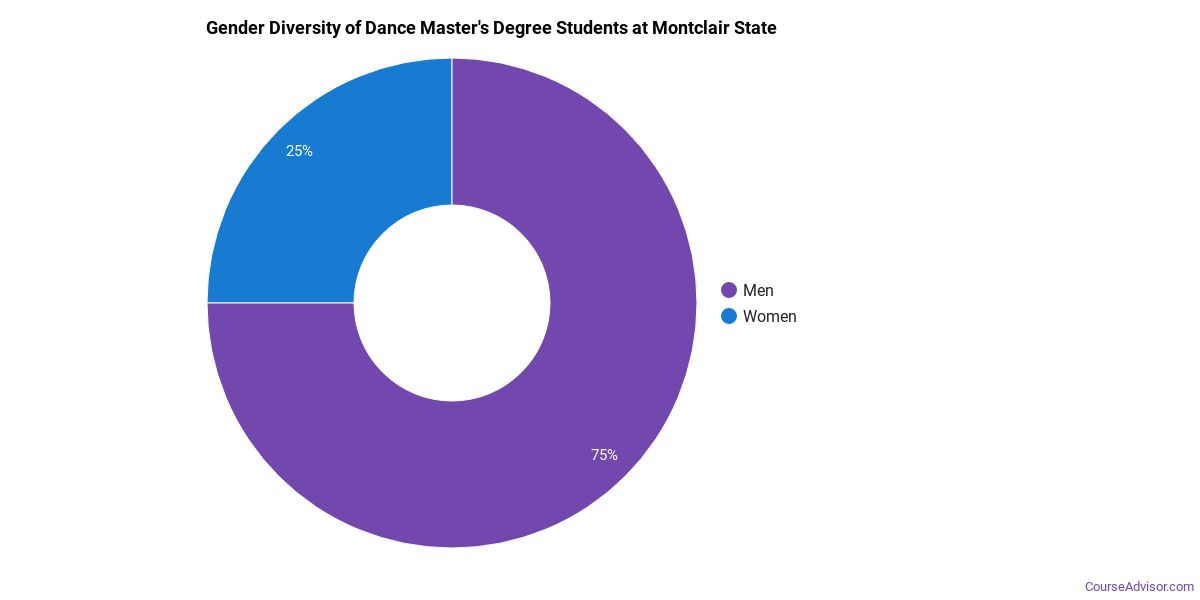
Of the 8 master’s dance graduates at Montclair State University, 88% were women (7) and 12% were men (1).
The following table and chart show the race/ethnicity of Dance master’s degree recipients at Montclair State University.
| Race / Ethnicity | Number of Graduates |
|---|---|
| White | 6 |
| Black / African American | 1 |
| Two or More Races | 1 |
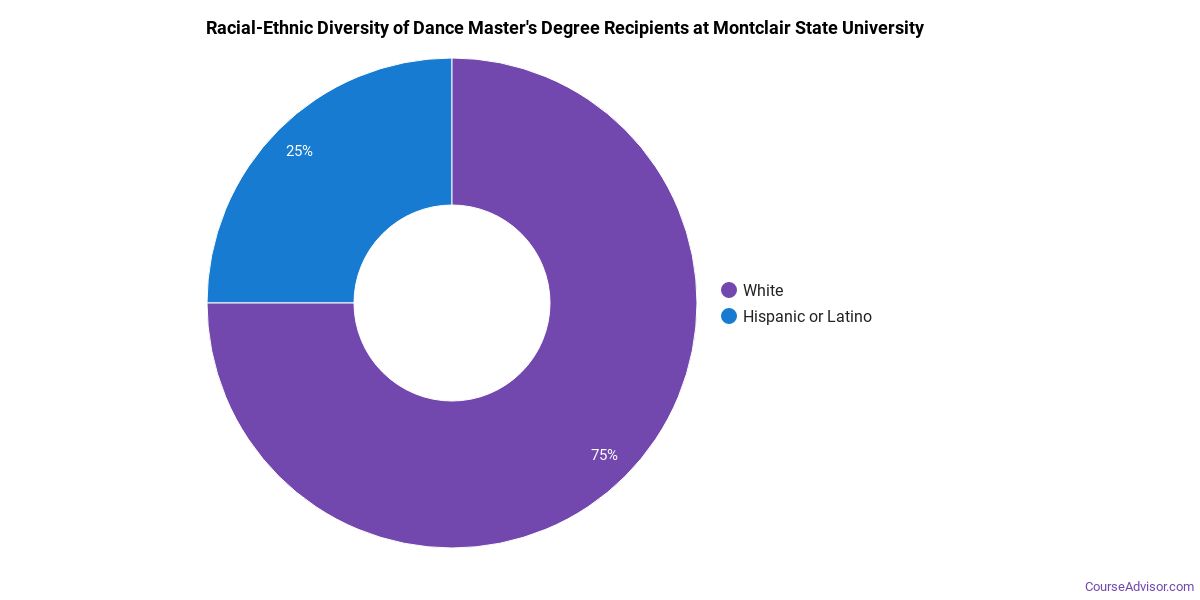
Racial-ethnic minorities make up 25% of Dance master’s degree recipients at Montclair State University, lower than the national average of 37%.*
*The racial-ethnic minorities figure is the total number of graduates minus White, international (nonresident), and unknown-race graduates.
More Specific Dance Concentrations at Montclair State University
The Dance program at Montclair State University includes the following sub-specializations:
| Concentration | Graduates |
|---|---|
| General Dance | 41 |
Highest-Paying Careers for Dance Graduates
Those who complete Dance program at Montclair State University work across a variety of fields. Here are the best-paid careers for Dance majors, ordered by median annual salary:
| Occupation | Nationwide Median Wage |
|---|---|
| Choreographers | $109,380 |
| Dancers | $74,180 |
| Art, Drama, and Music Teachers, Postsecondary | $46,983 |
References
- IPEDS — Integrated Postsecondary Education Data System
- U.S. Department of Education — College Scorecard
- O*NET Online (Bureau of Labor Statistics)
- National Center for Education Statistics
More about our data sources and methodologies.
Course Advisor provides higher-education, college and university, degree, program, career, salary, and other helpful information to students, faculty, institutions, and other internet audiences. Presented information and data are subject to change. Inclusion on this website does not imply or represent a direct relationship with the company, school, or brand. Information, though believed correct at time of publication, may not be correct, and no warranty is provided. Contact the schools to verify any information before relying on it. Financial aid may be available for those who qualify. The displayed options may include sponsored or recommended results, not necessarily based on your preferences.
© Course Advisor – All Rights Reserved.