Computer Engineering at Lawrence Technological University
If you plan to study Computer Engineering, take a look at what Lawrence Technological University. We’ve gathered the following information to help you decide.
Lawrence Technological University sits in Southfield, MI.
For the most recent IPEDS reporting year, 17 computer engineering graduations were recorded at Lawrence Technological University.
Featured schools near , edit
Online & Distance Learning at Lawrence Technological University
Online coursework is an option at Lawrence Technological University. Of 3,693 students, 279 (8%) studied exclusively online and 937 (25%) took at least some classes online.
Computer Engineering Rankings at Lawrence Technological University
Rankings can help you compare Lawrence Technological University’s Computer Engineering program to other colleges that offer this major.
Bachelor’s-Level Rankings
| Ranking | Scope | Rank |
|---|---|---|
| Best Schools (Quality) | Michigan | #6 of 10 |
| Best Value | Michigan | #10 of 10 |
| Best Schools (Quality) | Great Lakes (Region) | #20 of 44 |
| Best Value | Great Lakes (Region) | #41 of 44 |
| Best Schools (Quality) | Nationwide | #137 of 230 |
| Best Value | Nationwide | #205 of 229 |
Master’s-Level Rankings
| Ranking | Scope | Rank |
|---|---|---|
| Best Schools (Quality) | Michigan | #6 of 10 |
| Best Value | Michigan | #10 of 10 |
| Best Schools (Quality) | Great Lakes (Region) | #20 of 44 |
| Best Value | Great Lakes (Region) | #41 of 44 |
| Best Schools (Quality) | Nationwide | #137 of 230 |
| Best Value | Nationwide | #205 of 229 |
Student Demographics & Diversity
Take a look at the student demographics for Computer Engineering graduates at Lawrence Technological University, broken down by degree level.
Looking at the program as a whole, Computer Engineering graduates at Lawrence Technological University are 6% women (1) and 94% men (16).
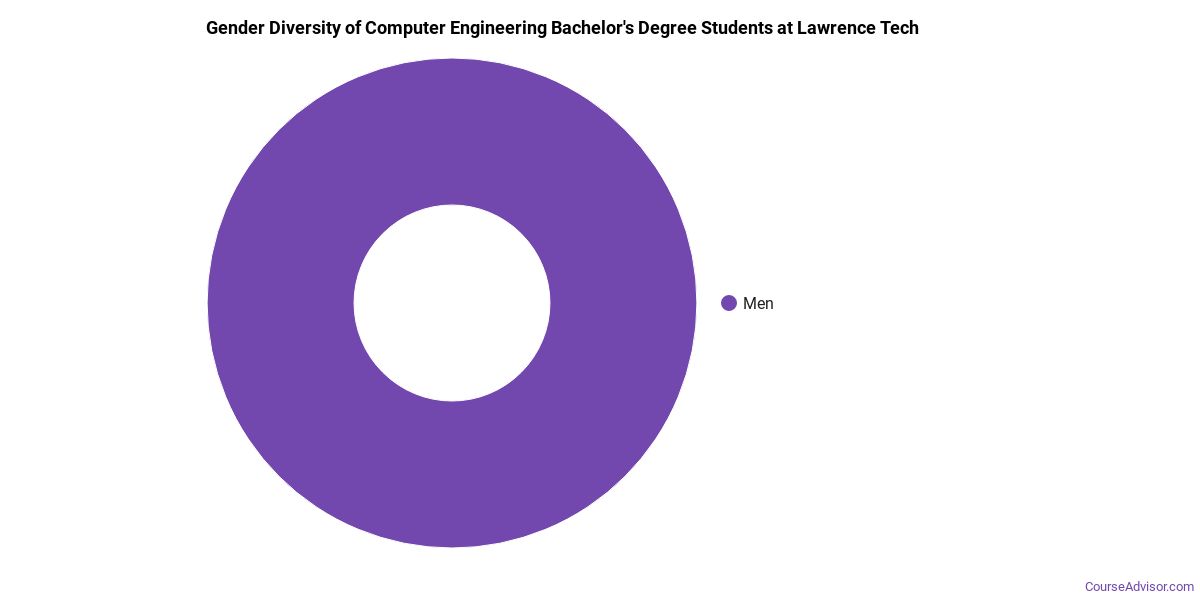
Computer Engineering Bachelor’s Program at Lawrence Technological University
Among the 13 bachelor’s computer engineering degrees awarded at Lawrence Technological University, 0% were women (0) and 100% were men (13).
The following table and chart show the race/ethnicity of Computer Engineering bachelor’s degree recipients at Lawrence Technological University.
| Race / Ethnicity | Number of Graduates |
|---|---|
| White | 3 |
| Asian | 1 |
| International (Nonresident) | 9 |
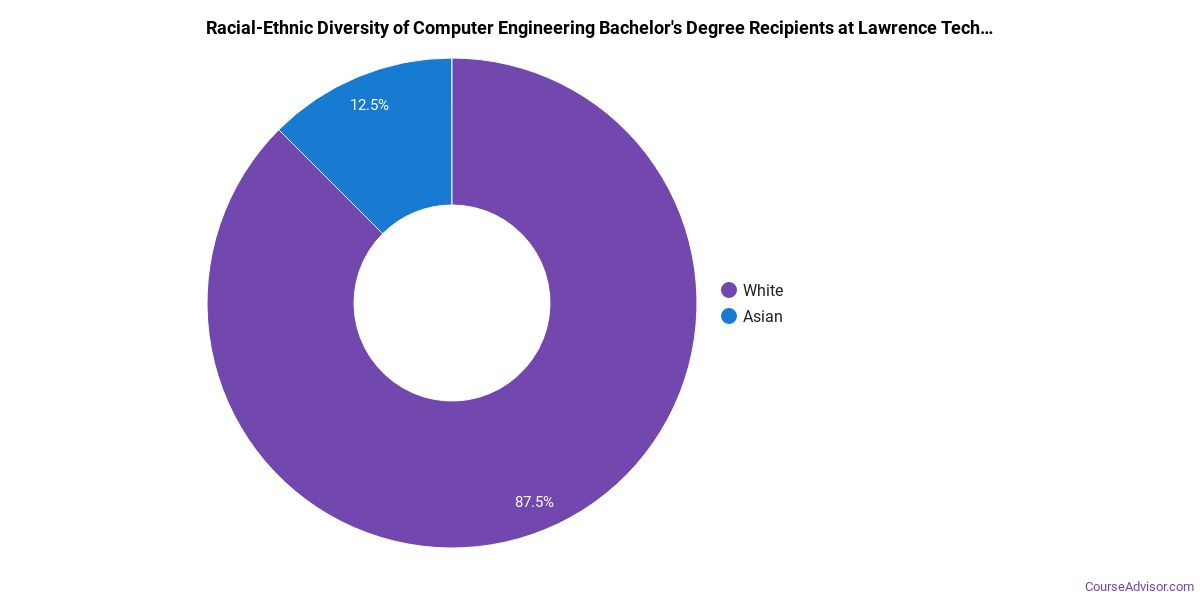
Minority students account for 8% of Computer Engineering bachelor’s degree recipients at Lawrence Technological University, lower than the national average of 45%.*
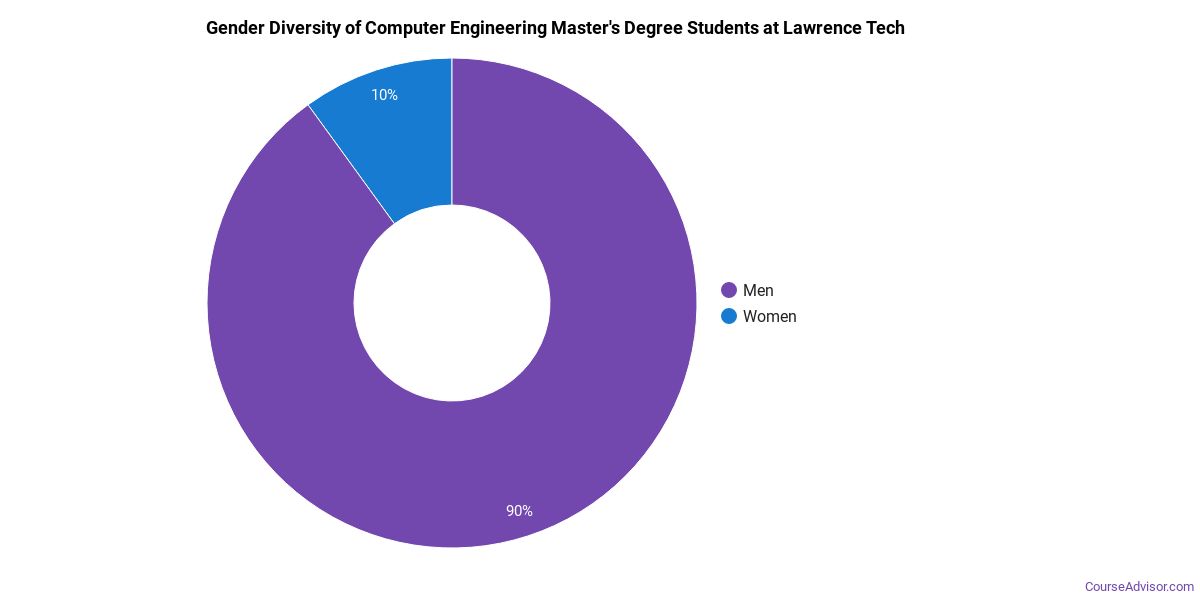
Computer Engineering Master’s Program at Lawrence Technological University
Among the 4 master’s computer engineering degrees awarded at Lawrence Technological University, 25% were women (1) and 75% were men (3).
The following table and chart show the race/ethnicity of Computer Engineering master’s degree recipients at Lawrence Technological University.
| Race / Ethnicity | Number of Graduates |
|---|---|
| White | 4 |
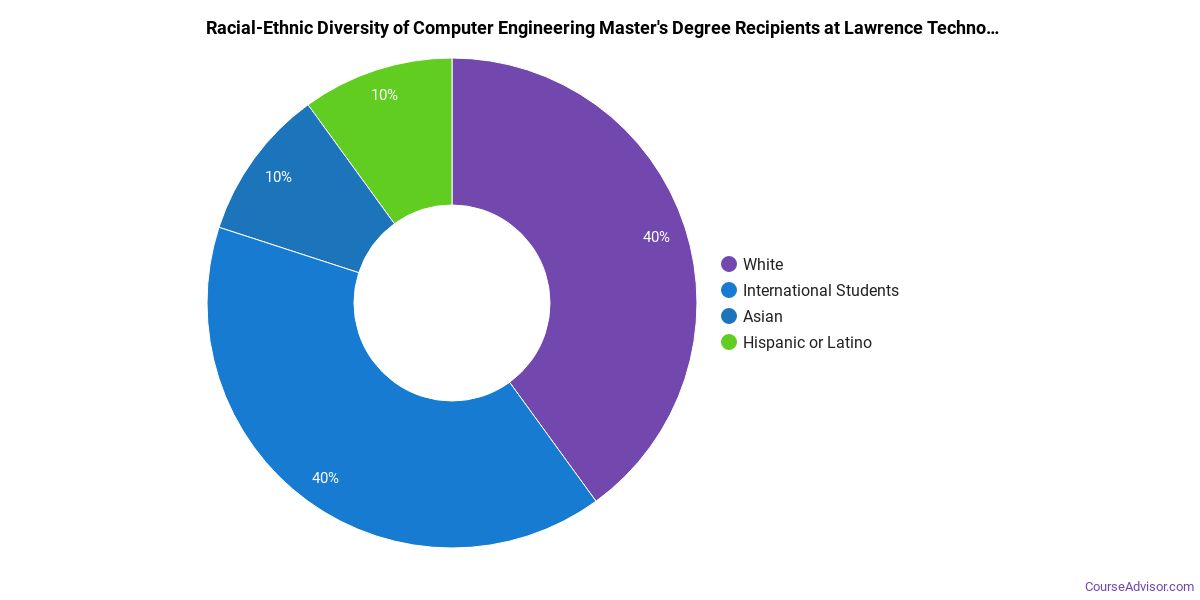
*The racial-ethnic minorities figure is the total number of graduates minus White, international (nonresident), and unknown-race graduates.
More Specific Computer Engineering Concentrations at Lawrence Technological University
The Computer Engineering program at Lawrence Technological University offers more specialized concentrations:
| Concentration | Graduates |
|---|---|
| General Computer Engineering | 13 |
| Other Computer Engineering | 4 |
Best-Paid Careers for Computer Engineering Graduates
Graduates of the Computer Engineering program at Lawrence Technological University work across a variety of fields. Below are the best-paid careers for Computer Engineering majors, ordered by median annual salary:
| Occupation | Nationwide Median Wage |
|---|---|
| Database Architects | $148,480 |
| Telecommunications Engineering Specialists | $117,478 |
| Data Warehousing Specialists | $117,424 |
| Architectural and Engineering Managers | $101,277 |
| Biofuels/Biodiesel Technology and Product Development Managers | $89,263 |
| Software Quality Assurance Analysts and Testers | $80,062 |
| Engineering Teachers, Postsecondary | $79,889 |
| Software Developers | $76,447 |
| Computer Hardware Engineers | $63,909 |
| Computer Network Architects | $63,411 |
References
- IPEDS — Integrated Postsecondary Education Data System
- U.S. Department of Education — College Scorecard
- O*NET Online (Bureau of Labor Statistics)
- National Center for Education Statistics
More about our data sources and methodologies.
Course Advisor provides higher-education, college and university, degree, program, career, salary, and other helpful information to students, faculty, institutions, and other internet audiences. Presented information and data are subject to change. Inclusion on this website does not imply or represent a direct relationship with the company, school, or brand. Information, though believed correct at time of publication, may not be correct, and no warranty is provided. Contact the schools to verify any information before relying on it. Financial aid may be available for those who qualify. The displayed options may include sponsored or recommended results, not necessarily based on your preferences.
© Course Advisor – All Rights Reserved.