Social Work at Hope College
What traits are you looking for in a school for Social Work, take a look at what Hope College. The following information will help you decide if it is a good fit for you.
Hope College sits in Holland, MI.
For the most recent IPEDS reporting year, 14 social work degrees were awarded at Hope College.
Featured schools near , edit
Online Class Availability at Hope College
Many students take online classes at Hope College. Among 3,395 students, 0 (0%) studied exclusively online and 349 (10%) took at least some classes online.
Social Work Rankings at Hope College
Use these rankings to compare Hope College’s Social Work program against peer institutions.
Bachelor’s-Level Rankings
| Ranking | Scope | Rank |
|---|---|---|
| Best Schools (Quality) | Michigan | #4 of 22 |
| Best Value | Michigan | #21 of 22 |
| Best Schools (Quality) | Great Lakes (Region) | #25 of 109 |
| Best Value | Great Lakes (Region) | #102 of 110 |
| Best Schools (Quality) | Nationwide | #165 of 570 |
| Best Value | Nationwide | #489 of 567 |
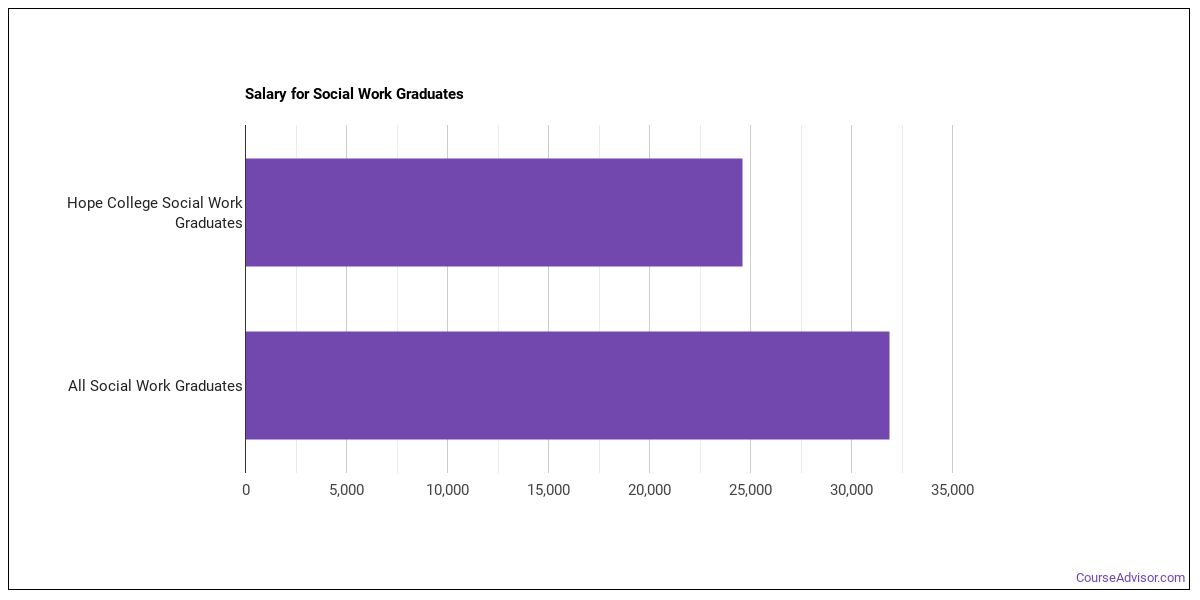
Earnings for Social Work Graduates from Hope College
Graduates of Hope College’s Social Work program earn the following amounts (per the U.S. Department of Education’s College Scorecard):
| Years After Graduation | Median Earnings |
|---|---|
| 1 year | $24,626 |
| 2 years | $31,581 |
| 4 years | $48,054 |
| 5 years | $52,793 |
Is this above or below average for the school? Four years after graduating, Social Work graduates from Hope College earn a median of $48,054, compared with $53,553 for all Hope College graduates — about 10% lower than the school-wide median.

Median Debt at Graduation
Typical debt at graduation for Social Work graduates from Hope College is $26,670.
Student Demographics & Diversity
The following sections describe the student demographics for Social Work graduates at Hope College, by degree type.
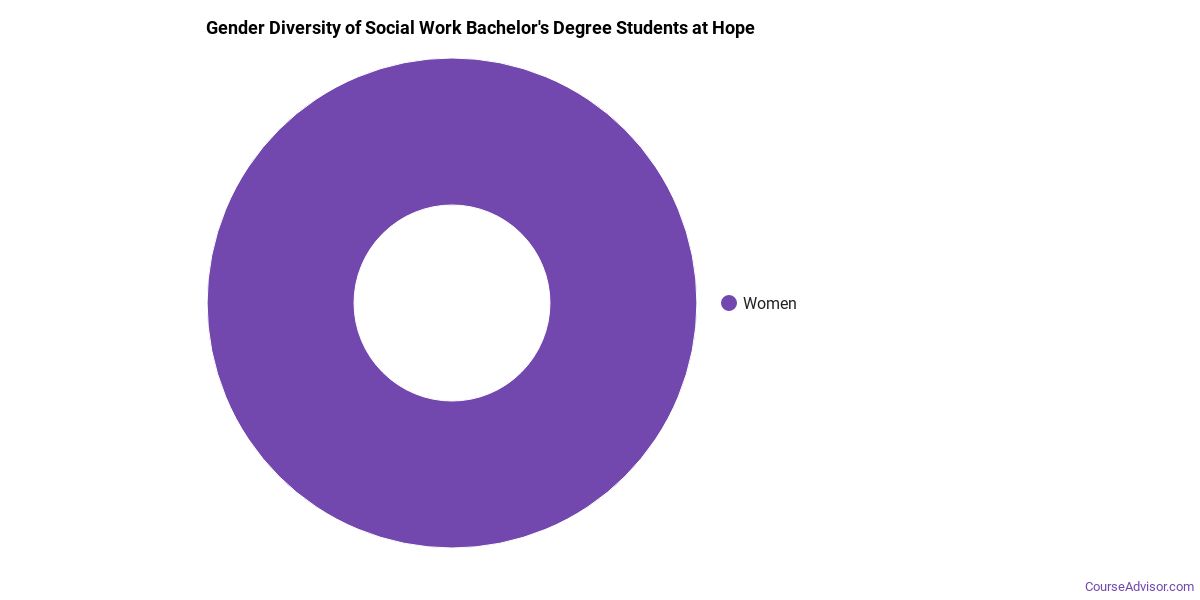
Program-wide, Social Work graduates at Hope College are 100% women (14) and 0% men (0).
Social Work Bachelor’s Program at Hope College
Among the 14 bachelor’s social work degrees awarded at Hope College, 100% were women (14) and 0% were men (0).
The following table and chart show the race/ethnicity of Social Work bachelor’s degree recipients at Hope College.
| Race / Ethnicity | Number of Graduates |
|---|---|
| White | 12 |
| Two or More Races | 2 |
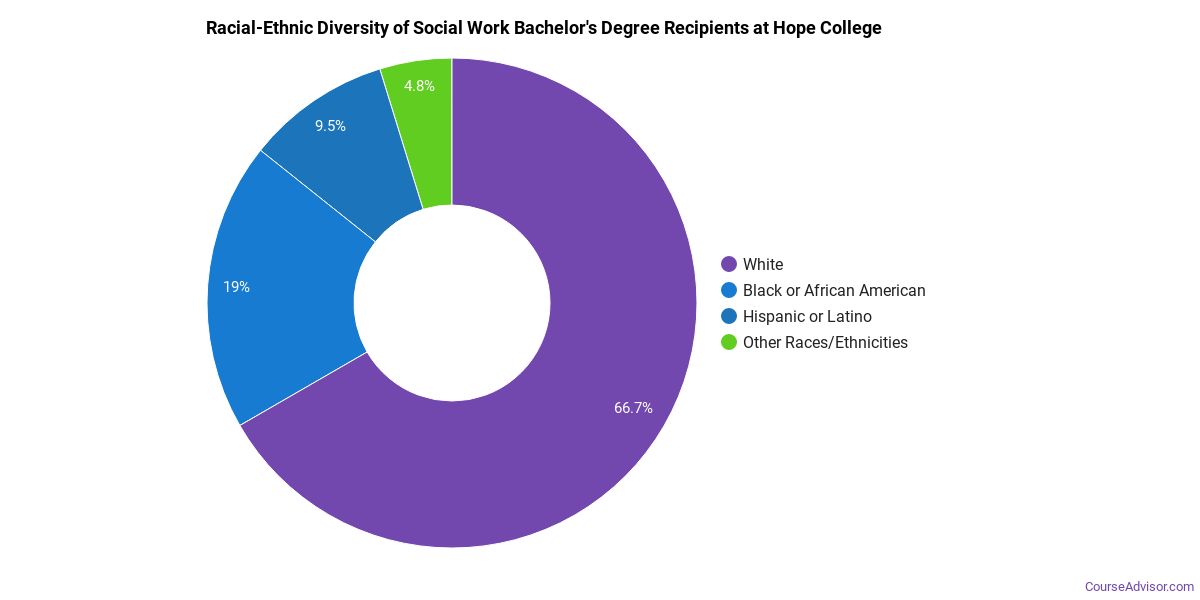
Racial-ethnic minorities make up 14% of Social Work bachelor’s degree recipients at Hope College, below the national average of 48%.*
*The racial-ethnic minorities figure is the total number of graduates minus White, international (nonresident), and unknown-race graduates.
More Specific Social Work Concentrations at Hope College
The Social Work program at Hope College breaks down into more specific concentrations:
| Concentration | Graduates |
|---|---|
| Social Work | 14 |
Highest-Paying Careers for Social Work Graduates
Students who finish Social Work program at Hope College pursue many career paths. The table below ranks the best-paid careers for Social Work majors, ordered by median annual salary:
| Occupation | Nationwide Median Wage |
|---|---|
| Social and Community Service Managers | $156,089 |
| Counselors, All Other | $81,766 |
| Healthcare Social Workers | $78,044 |
| Marriage and Family Therapists | $74,325 |
| Social Work Teachers, Postsecondary | $65,510 |
| Social Workers, All Other | $62,827 |
| Mental Health and Substance Abuse Social Workers | $58,560 |
| Child, Family, and School Social Workers | $41,658 |
| Probation Officers and Correctional Treatment Specialists | $40,804 |
References
- IPEDS — Integrated Postsecondary Education Data System
- U.S. Department of Education — College Scorecard
- O*NET Online (Bureau of Labor Statistics)
- National Center for Education Statistics
More about our data sources and methodologies.
Course Advisor provides higher-education, college and university, degree, program, career, salary, and other helpful information to students, faculty, institutions, and other internet audiences. Presented information and data are subject to change. Inclusion on this website does not imply or represent a direct relationship with the company, school, or brand. Information, though believed correct at time of publication, may not be correct, and no warranty is provided. Contact the schools to verify any information before relying on it. Financial aid may be available for those who qualify. The displayed options may include sponsored or recommended results, not necessarily based on your preferences.
© Course Advisor – All Rights Reserved.