Criminal Justice & Corrections at Franklin University
What traits are you looking for in a school for Criminal Justice & Corrections, consider the program at Franklin University. We’ve gathered the following information to help you decide.
Franklin University is in Columbus, OH.
In the most recent year for which we have data, 186 criminal justice & corrections degrees were granted at Franklin University.
Featured schools near , edit
Online Class Availability at Franklin University
Online coursework is an option at Franklin University. Among 9,457 students, 8,801 (93%) studied exclusively online and 298 (3%) took at least some classes online.
Criminal Justice & Corrections Rankings at Franklin University
Use these rankings to compare Franklin University’s Criminal Justice & Corrections program against peer institutions.
Bachelor’s-Level Rankings
| Ranking | Scope | Rank |
|---|---|---|
| Best Schools (Quality) | Ohio | #20 of 49 |
| Best Value | Ohio | #39 of 48 |
| Best Schools (Quality) | Great Lakes (Region) | #94 of 167 |
| Best Value | Great Lakes (Region) | #148 of 166 |
| Best Schools (Quality) | Nationwide | #543 of 1,205 |
| Best Value | Nationwide | #1033 of 1,206 |
Master’s-Level Rankings
| Ranking | Scope | Rank |
|---|---|---|
| Best Schools (Quality) | Ohio | #20 of 49 |
| Best Value | Ohio | #39 of 48 |
| Best Schools (Quality) | Great Lakes (Region) | #94 of 167 |
| Best Value | Great Lakes (Region) | #148 of 166 |
| Best Schools (Quality) | Nationwide | #543 of 1,205 |
| Best Value | Nationwide | #1033 of 1,206 |
Associate-Level Rankings
| Ranking | Scope | Rank |
|---|---|---|
| Best Schools (Quality) | Ohio | #20 of 49 |
| Best Value | Ohio | #39 of 48 |
| Best Schools (Quality) | Great Lakes (Region) | #94 of 167 |
| Best Value | Great Lakes (Region) | #148 of 166 |
| Best Schools (Quality) | Nationwide | #543 of 1,205 |
| Best Value | Nationwide | #1033 of 1,206 |
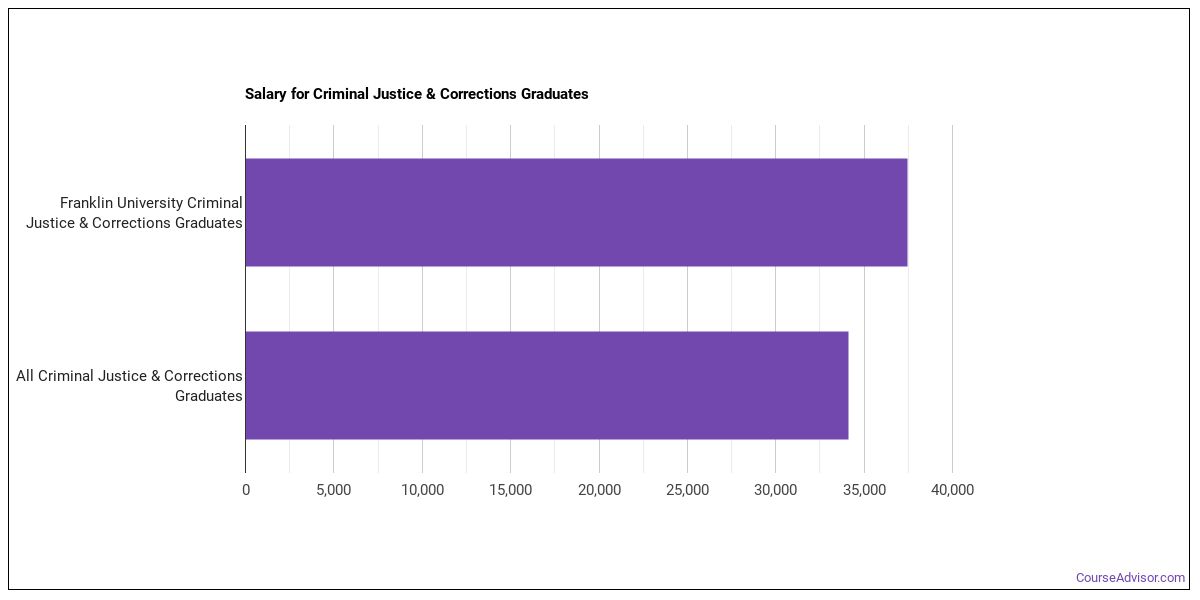
Earnings for Criminal Justice & Corrections Graduates from Franklin University
Graduates of Franklin University’s Criminal Justice & Corrections program report the following median earnings (per the U.S. Department of Education’s College Scorecard):
| Years After Graduation | Median Earnings |
|---|---|
| 1 year | $37,442 |
| 2 years | $39,523 |
| 3 years | $44,090 |
| 4 years | $50,219 |
| 5 years | $54,310 |
How does this compare to the school overall? At the four-year mark, Criminal Justice & Corrections graduates from Franklin University earn a median of $50,219, compared with $60,582 for all Franklin University graduates — about 17% lower than the school-wide median.

Median Debt at Graduation
The median debt for Criminal Justice & Corrections graduates from Franklin University is $28,750.
Student Demographics & Diversity
Below you’ll find the diversity of Criminal Justice & Corrections graduates at Franklin University, broken down by degree level.
Looking at the program as a whole, Criminal Justice & Corrections graduates at Franklin University are 53% women (99) and 47% men (87).
Criminal Justice & Corrections Associate’s Program at Franklin University
Among the 6 associate’s criminal justice & corrections graduates at Franklin University, 83% were women (5) and 17% were men (1).

The following table and chart show the race/ethnicity of Criminal Justice & Corrections associate’s degree recipients at Franklin University.
| Race / Ethnicity | Number of Graduates |
|---|---|
| White | 2 |
| Black / African American | 2 |
| Unknown | 2 |
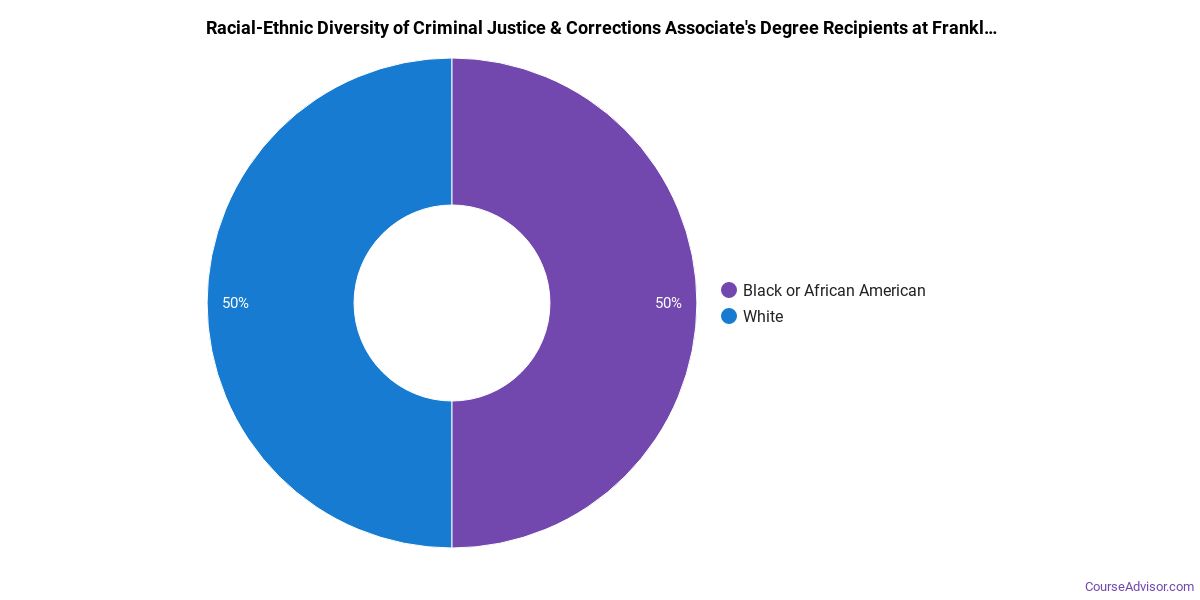
Racial-ethnic minorities make up 33% of Criminal Justice & Corrections associate’s degree recipients at Franklin University, lower than the national average of 58%.*
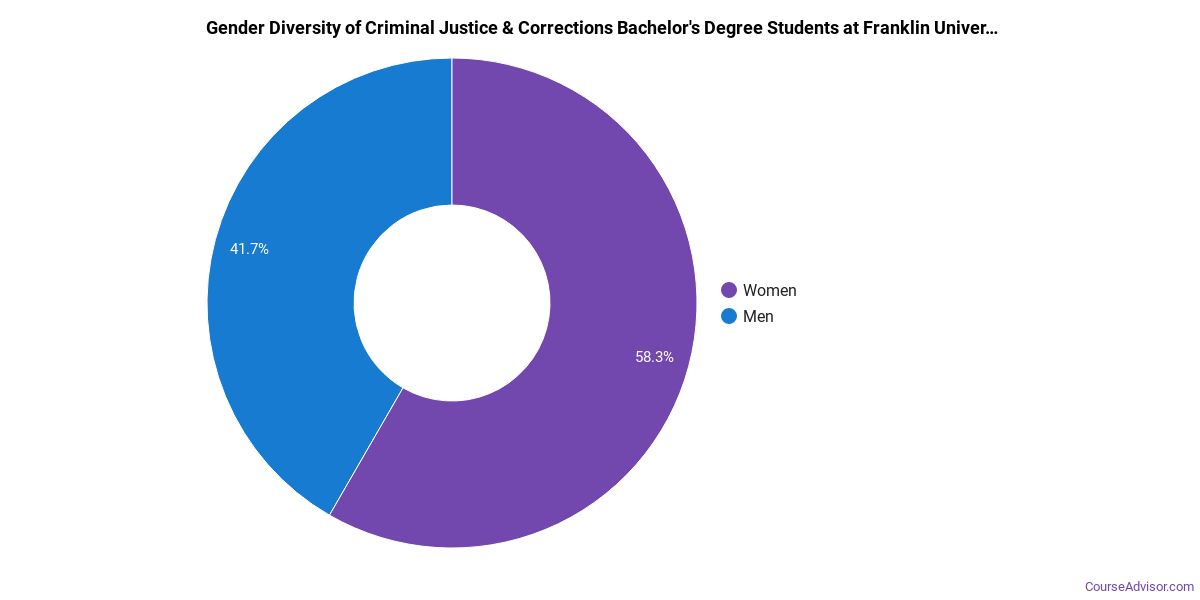
Criminal Justice & Corrections Bachelor’s Program at Franklin University
Of the 157 bachelor’s criminal justice & corrections degrees awarded at Franklin University, 52% were women (81) and 48% were men (76).
The following table and chart show the race/ethnicity of Criminal Justice & Corrections bachelor’s degree recipients at Franklin University.
| Race / Ethnicity | Number of Graduates |
|---|---|
| White | 95 |
| Hispanic / Latino | 20 |
| Black / African American | 32 |
| Native Hawaiian / Pacific Islander | 1 |
| Two or More Races | 5 |
| Unknown | 4 |
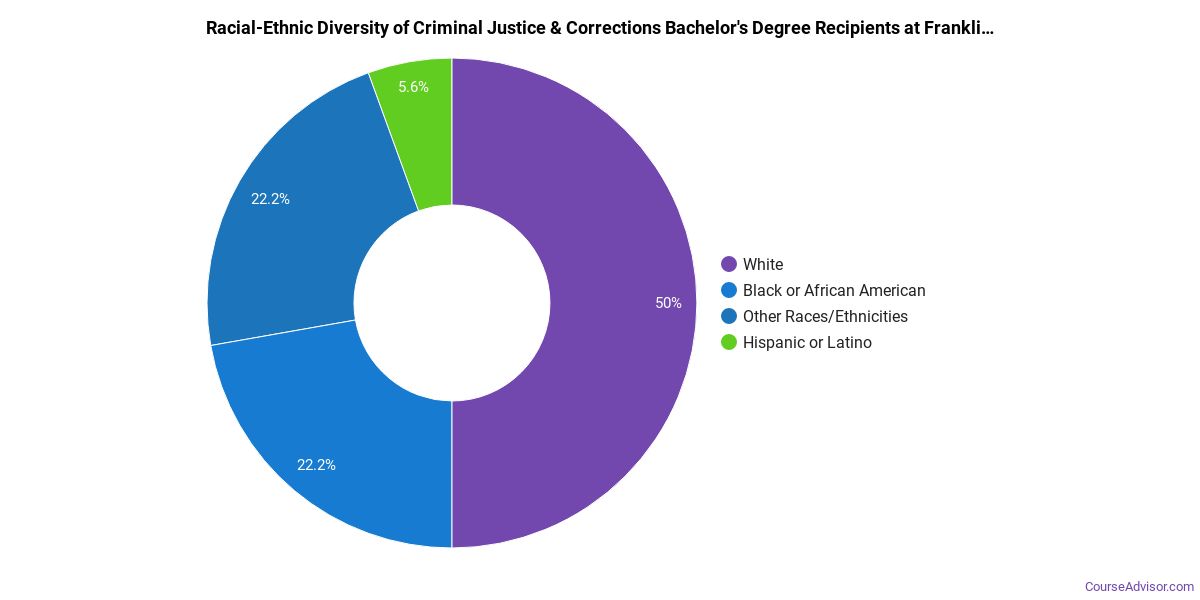
Minority students account for 37% of Criminal Justice & Corrections bachelor’s degree recipients at Franklin University, lower than the national average of 52%.*
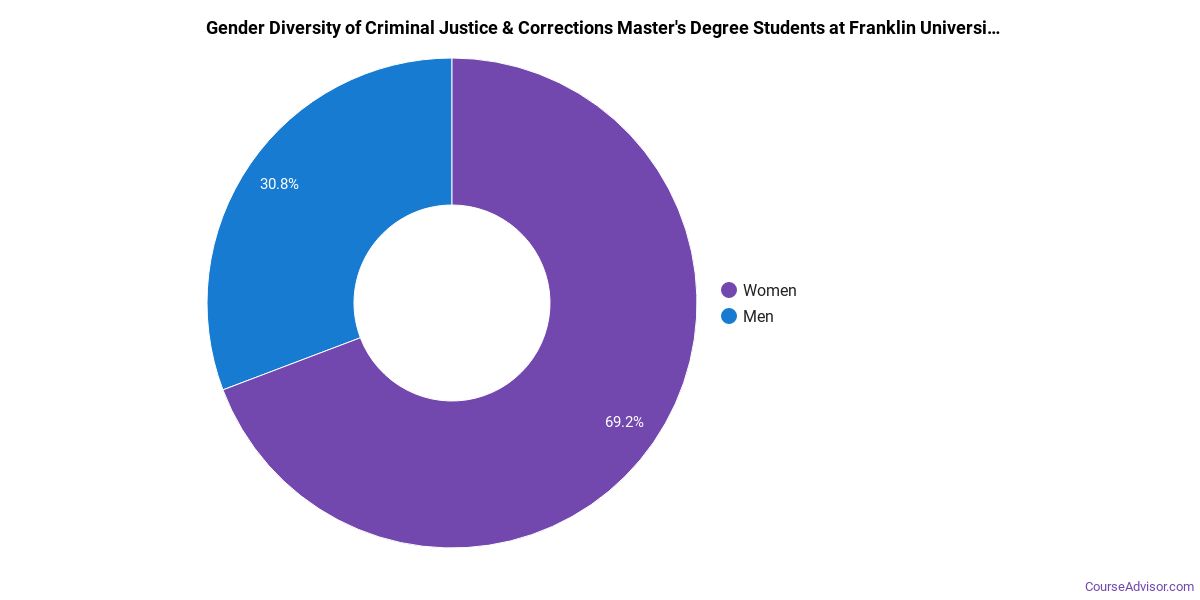
Criminal Justice & Corrections Master’s Program at Franklin University
Among the 19 master’s criminal justice & corrections graduates at Franklin University, 63% were women (12) and 37% were men (7).
The following table and chart show the race/ethnicity of Criminal Justice & Corrections master’s degree recipients at Franklin University.
| Race / Ethnicity | Number of Graduates |
|---|---|
| White | 13 |
| Black / African American | 6 |
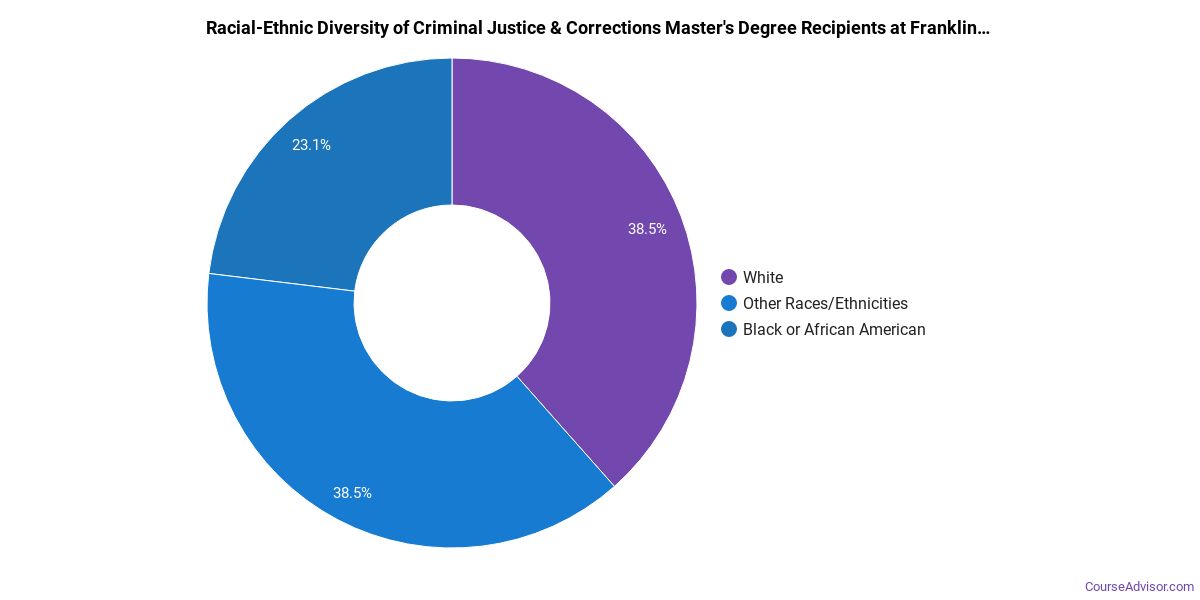
Minority students account for 32% of Criminal Justice & Corrections master’s degree recipients at Franklin University, lower than the national average of 47%.*
*The racial-ethnic minorities figure is the total number of graduates minus White, international (nonresident), and unknown-race graduates.
More Specific Criminal Justice & Corrections Concentrations at Franklin University
The Criminal Justice & Corrections program at Franklin University includes the following sub-specializations:
| Concentration | Graduates |
|---|---|
| Criminal Justice | 186 |
Top-Paying Careers for Criminal Justice & Corrections Graduates
Those who complete Criminal Justice & Corrections program at Franklin University work across a variety of fields. Here are the highest-paying careers for Criminal Justice & Corrections graduates, ordered by median annual salary:
| Occupation | Nationwide Median Wage |
|---|---|
| Wind Energy Development Managers | $169,952 |
| Loss Prevention Managers | $165,723 |
| Wind Energy Operations Managers | $122,567 |
| Environmental Compliance Inspectors | $119,630 |
| Compliance Managers | $117,178 |
| Coroners | $110,095 |
| Brownfield Redevelopment Specialists and Site Managers | $99,321 |
| Managers, All Other | $95,684 |
| Criminal Justice and Law Enforcement Teachers, Postsecondary | $91,449 |
| Regulatory Affairs Specialists | $85,399 |
References
- IPEDS — Integrated Postsecondary Education Data System
- U.S. Department of Education — College Scorecard
- O*NET Online (Bureau of Labor Statistics)
- National Center for Education Statistics
More about our data sources and methodologies.
Course Advisor provides higher-education, college and university, degree, program, career, salary, and other helpful information to students, faculty, institutions, and other internet audiences. Presented information and data are subject to change. Inclusion on this website does not imply or represent a direct relationship with the company, school, or brand. Information, though believed correct at time of publication, may not be correct, and no warranty is provided. Contact the schools to verify any information before relying on it. Financial aid may be available for those who qualify. The displayed options may include sponsored or recommended results, not necessarily based on your preferences.
© Course Advisor – All Rights Reserved.